Live data from Hacker News

Flame Graphs: Making the opaque obvious (2017)

tech.popdata.org

21–30 of 58 posts

Re: Flame Graphs: Making the opaque obvious (2017)

#21

Earlier quoted context omitted.

> Did you read the linked article? From https://news.ycombinator.com/newsguidelines.html : "Please don't comment on whether someone read an article" And yes, I did, and I truly don't grasp even the 'simple' explanation. I already admitted I'm dumb. Do you have anything to add to the discussion?

> Do you have anything to add to the discussion? Do you ? Can you point out where it (edit: the simple example) breaks down, instead of just repeating that you're dumb?
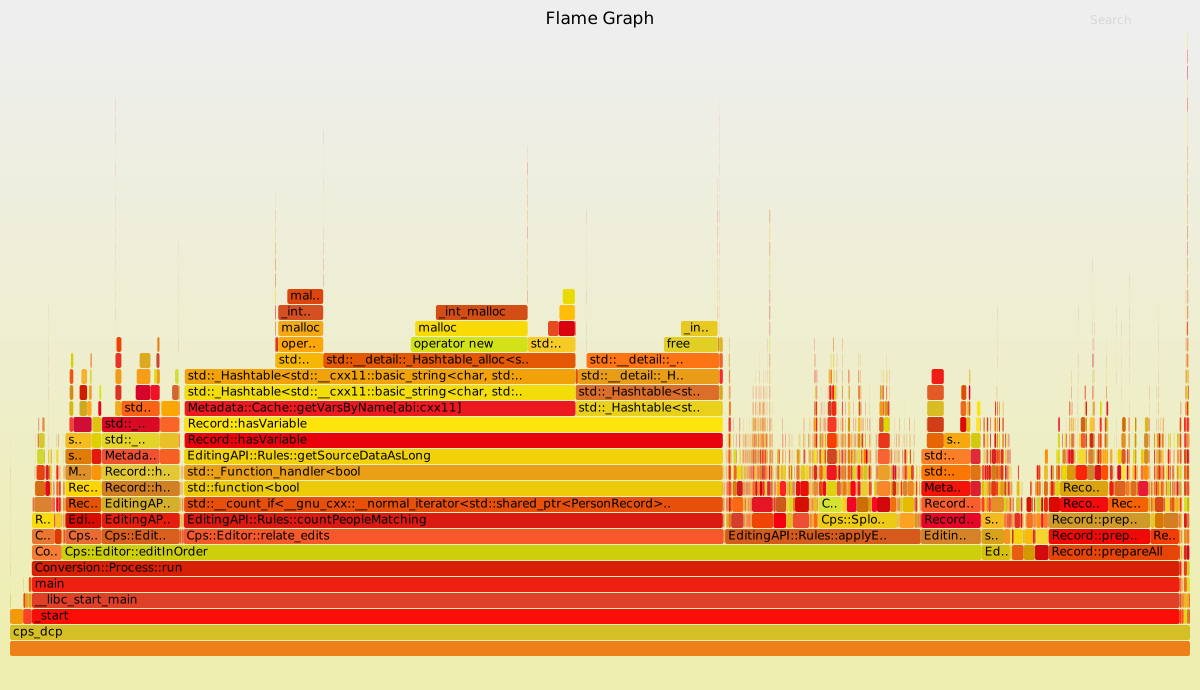
By the 'simple example', I assume you mean https://tech.popdata.org/images/cps1970_before_fix_dwarf_gcc...?

If so, the widest, reddest, and highest-magnitude function I see there is __int__malloc. Right?

Yet, reading on, it seems that has nothing to do with anything, and the actual culprit is Record::hasVariable, which is somewhere in the middle of the graph, and not any redder or less red, or wider or less wide, than many other functions.

So, looking at just the first graph, how am I supposed to immediately spot the culprit?

Re: Flame Graphs: Making the opaque obvious (2017)

#22

Earlier quoted context omitted.

As an example, imagine you sampled a program and got 5 CPU call stack samples. c c b b d a a a a a main main main main main In a flamegraph, you would see: [c ] [b ][d ] [a ] [main ]

Yeah, I imagine it, and still don't see how the flame graph would help? Shown as a hierarchical bar chart, this would suggest 'b' is problematic. Where, color-wise (because peak-wise, 'c' would be the culprit here) do I see this issue in a flame graph? Because I fear that either 'main' or 'a' would have the most dominant shade of red here?

Peaks don't matter, they just correspond to the depth of the call stack.

Probably the simplest way to use the flame graph is work from the bottom of the flamegraph and walk upwards until you find something interesting you optimize. Ideally you find something wide to optimize that makes sense. (The widest thing here is "main" which is obviously probably not the interesting thing to optimize, so you would work upwards from there.) The basic idea is that things that are wide in the flamegraph are expensive and potential things to optimize.

Where I work, we have tools that can produce diffed flamegraphs which can be really useful in figuring out why one trace uses so much more/less CPU than another.

Re: Flame Graphs: Making the opaque obvious (2017)

#23

Earlier quoted context omitted.

> Do you have anything to add to the discussion? Do you ? Can you point out where it (edit: the simple example) breaks down, instead of just repeating that you're dumb?

By the 'simple example', I assume you mean https://tech.popdata.org/images/cps1970_before_fix_dwarf_gcc... ? If so, the widest, reddest, and highest-magnitude function I see there is __int__malloc. Right? Yet, reading on, it seems that has nothing to do with anything, and the actual culprit is Record::hasVariable, which is somewhere in the middle of the graph, and not any redder or less red, or wider or less wide, th…

I haven’t read the article. However, here is how I read the chart:

Record::hasVariable takes a long time. You can see that because it’s wide and red. The immediate ones below it on the chart don’t do anything but call it; you can see that because they are basically the same width. hasVariable splits into two calls (the row above). I’m going from memory here because I don’t have the chart here, but I think it should be clear from the trace:

A) hasVariable takes a lot of compute time

B) from the name, this seems surprising / non optimal.

C) Digging into the functions above it will yield chances to optimize.

I do agree that the malloc is sort of a surprising amount of the total percentage of hasVariable. Again, just from the flame graph and function names, I’d bet that some memory allocations are being done in a loop inside and would be much faster to allocate outside the hasVariable call, and get reused.

Re: Flame Graphs: Making the opaque obvious (2017)

#24

Earlier quoted context omitted.

Yeah, I imagine it, and still don't see how the flame graph would help? Shown as a hierarchical bar chart, this would suggest 'b' is problematic. Where, color-wise (because peak-wise, 'c' would be the culprit here) do I see this issue in a flame graph? Because I fear that either 'main' or 'a' would have the most dominant shade of red here?

Peaks don't matter, they just correspond to the depth of the call stack. Probably the simplest way to use the flame graph is work from the bottom of the flamegraph and walk upwards until you find something interesting you optimize. Ideally you find something wide to optimize that makes sense. (The widest thing here is "main" which is obviously probably not the interesting thing to optimize, so you would work upwards…

> Probably the simplest way to use the flame graph is work from the bottom of the flamegraph and walk upwards until you find something interesting you optimize

OK, so going by what is apparently the 'simple example' in the linked article: https://tech.popdata.org/images/cps1970_before_fix_dwarf_gcc...

I work my way up. First thing that is really red is Conversion::Process::Run, but that probably wraps a lot of things, so I keep going up.

Next is Cps::Editor::relate_edits, or possibly EditingAPI::Rules::countPeopleMatching, because it's a darker red?

And then there is another red-ish function, followed(?) by some yellow-colored (and thus unimportant?) stack entries, and then the apparent culprit: Record::hasVariable.

So, and I'm truly not trying to be difficult or argumentative here: how was I supposed to pick out 'Record::hasVariable' right away from 'https://tech.popdata.org/images/cps1970_before_fix_dwarf_gcc...'?

The first function that is red being called from yellow-colored functions with about the same duration (width)? And if so, why is Metadata::Cache::getVarsByName not a more likely optimization target?

Re: Flame Graphs: Making the opaque obvious (2017)

#25

Earlier quoted context omitted.

> Do you have anything to add to the discussion? Do you ? Can you point out where it (edit: the simple example) breaks down, instead of just repeating that you're dumb?

By the 'simple example', I assume you mean https://tech.popdata.org/images/cps1970_before_fix_dwarf_gcc... ? If so, the widest, reddest, and highest-magnitude function I see there is __int__malloc. Right? Yet, reading on, it seems that has nothing to do with anything, and the actual culprit is Record::hasVariable, which is somewhere in the middle of the graph, and not any redder or less red, or wider or less wide, th…

By simple example, I mean this: https://tech.popdata.org/images/flamegraph-example.svg

But looking at the one you're referencing, slightly out of order:

> highest-magnitude function I see there is __int__malloc.

Height shows stack depth, not magnitude.

> the actual culprit is Record::hasVariable, which is somewhere in the middle of the graph, and not any redder or less red, or wider or less wide, than many other functions.

> not any redder or less red

The colors are randomized to help with contrast (Brendan's website mentions this practice), so they aren't conveying any information.

> or wider or less wide

That's not really true. Hovering over Record::hasVariable tells that this bar covers 45.6% of the runtime. The only bars wider than that are the callers of Record::hasVariable (edit: rather, the stack through which Record::hasVariable is being called), i.e. the bars on which Record::hasVariable is resting.

> somewhere in the middle of the graph

Sure - being in the middle height-wise means that it's somewhere in the middle of the call stack. But there are some clues to its relevance:

1. It's close to the boundary between application code and standard library code. It does call MetaData::Cache::getVarsByName, which (going by the name) also is part of the application, but everything deeper in the stack (i.e. on top of those bars) is purely std:: stuff.

2. Domain knowledge. The text alludes to this: Record::hasVariable is a conceptually simple operation that's not expected to be a major part of the runtime.

This does not mean that Record::hasVariable must be the culprit. Maybe some function higher in the call stack (e.g. EditingAPI::Rules::getSourceDataAsLong) is calling Record::hasVariable way too many times? But it's a good place to start looking.

Re: Flame Graphs: Making the opaque obvious (2017)

#26

How do flame graphs handle the case where most of the time is spent in some leaf function that is called from all over the program? In this case, each individual stack would not take much time but in aggregate, a lot of time is spent in the function at the top of all of the call stacks. This should not be that uncommon to have hotspots in things like copying routines, compression, encryption etc that are not associat…

I had the same experience/question at some point when I noticed (and investigated), why didn't a new Ubuntu Linux install break out interrupt usage in vmstat anymore. [1]

Perf+flamegraphs were able to catch in-interrupt-handling samples as I was on a bare metal machine with PMU counters accessible. But the various NVMe I/O completion interrupts happened all over the place, even when the CPUs were in random userspace code sections. Neither the bottom-up & top-down FlameGraph approach made it visually clear in this case.

But since interrupt time did show up and since the FlameGraph JS tool had a text search box, I searched for "interrupt" or "irq" in the search box - and the JS code highlighted all matching sections with purple color (completely distinct from the classic color range of flamegraphs). And seeing that purple color all over the place made me smile and gave me a strong visual "a-ha" moment. Probably with some extra JS tinkering, these kinds of "events scattered all over the place" scenarios could be made even clearer.

[1] https://news.ycombinator.com/item?id=26139611 (2021)

Re: Flame Graphs: Making the opaque obvious (2017)

#27

Earlier quoted context omitted.

By the 'simple example', I assume you mean https://tech.popdata.org/images/cps1970_before_fix_dwarf_gcc... ? If so, the widest, reddest, and highest-magnitude function I see there is __int__malloc. Right? Yet, reading on, it seems that has nothing to do with anything, and the actual culprit is Record::hasVariable, which is somewhere in the middle of the graph, and not any redder or less red, or wider or less wide, th…

I haven’t read the article. However, here is how I read the chart: Record::hasVariable takes a long time. You can see that because it’s wide and red. The immediate ones below it on the chart don’t do anything but call it; you can see that because they are basically the same width. hasVariable splits into two calls (the row above). I’m going from memory here because I don’t have the chart here, but I think it should b…

> Record::hasVariable takes a long time

As does Memdata::Cache::getVarsByName[blah] right above it, and many functions below (unsurprisingly, but still...), and they all have pretty much the same width and color.

The point of flame graph proponents is that "you see where the problem is right away."

My question is: "how, exactly?" And the answers so far seems to be mostly... lacking, to the point that I now officially declare flame graphs a cargo cult that is in no way superior to my "hierarchical bar charts" religion...

Re: Flame Graphs: Making the opaque obvious (2017)

#28

OK, shameful confession time here: I just cannot grasp flame charts, no matter how hard I try. And yes: that's just me, I'm dumb, etc. etc. (and I freely admit all of that, including the et-ceteras!) I tried to follow along with things that are relevant to my job, like https://randomascii.wordpress.com/2016/09/05/etw-flame-graph... ...And totally failed? I look at the reddest part of the chart, I look at the peaks, a…

I don’t know if it helps, but this is how I read through the graph from the first article after reading the authors conclusion. (I’m an idiot)

- okay, we’re analyzing DvrDrawImage - Let’s analyze the function on the left, GpBitmap::PipeLockBits - Up through ::Decode, takes up 100% of the time from PipeLockBits, so we’re just racing down the call stack to get to that point, and then other stuff starts taking up time - Lots of WindowsCodecs calls, I guess we kind of expect those to be valid since image processing needs codecs and stuff and things - Okay, now there’s a bar taking up ~45-50% of the ::Decode call, that’s not a codec or drawing related thing- it’s an os level pagefault. That’s fucky. - Since the ::Decode call is ~55-65% of the ::DvrDrawImage call, that pagefault is (~40% of ~60% =)~25% of this draw image call

So essentially I looked and saw a stack of bars altogether and went ‘okay, the call at the top of this is the only reason the call 6 bars up the stack (ie, 6 bars down on the flamegraph) is taking time, why?’, and start applying the same process recursively from there.

That is, until $why == ‘due to codec calls and an ntkernel call’, and the question becomes ‘is that valid?’ Then the question becomes “are these codec calls taking the amount of time I would expect?”, and “

iiuc peaks and colors don’t matter. Tbf I think the colorscheming on this chart is shit- afaik flamegraph coloring is just a way of marking the same (or from the same library? Implementation dependent?) function for easy spotting. Like why not make the functions wildly different colors. Redness != hotness of a certain codepath.

The only thing peaks indicate is calls that have deeply nested function calls, which I guess would be important if you’re having recursion issues.

Re: Flame Graphs: Making the opaque obvious (2017)

#29

Earlier quoted context omitted.

By the 'simple example', I assume you mean https://tech.popdata.org/images/cps1970_before_fix_dwarf_gcc... ? If so, the widest, reddest, and highest-magnitude function I see there is __int__malloc. Right? Yet, reading on, it seems that has nothing to do with anything, and the actual culprit is Record::hasVariable, which is somewhere in the middle of the graph, and not any redder or less red, or wider or less wide, th…

By simple example, I mean this: https://tech.popdata.org/images/flamegraph-example.svg But looking at the one you're referencing, slightly out of order: > highest-magnitude function I see there is __int__malloc. Height shows stack depth, not magnitude. > the actual culprit is Record::hasVariable, which is somewhere in the middle of the graph, and not any redder or less red, or wider or less wide, than many other func…

Ah, OK, so there is a graph, where magnitude is meaningless, colors are meaningless, runtime is relative, yet, with "enough domain knowledge" you can "see where the problem is right away"...

I'm pretty sure we're done here.

Re: Flame Graphs: Making the opaque obvious (2017)

#30

Earlier quoted context omitted.

By simple example, I mean this: https://tech.popdata.org/images/flamegraph-example.svg But looking at the one you're referencing, slightly out of order: > highest-magnitude function I see there is __int__malloc. Height shows stack depth, not magnitude. > the actual culprit is Record::hasVariable, which is somewhere in the middle of the graph, and not any redder or less red, or wider or less wide, than many other func…

Ah, OK, so there is a graph, where magnitude is meaningless, colors are meaningless, runtime is relative, yet, with "enough domain knowledge" you can "see where the problem is right away"... I'm pretty sure we're done here.

> I'm pretty sure we're done here.

Sorry to hear.

Post reply on HN