Live data from Hacker News

Misinterpreting hurricane forecasts

nytimes.com

91–100 of 112 posts

Re: Misinterpreting hurricane forecasts

#91
post #10

"The National Hurricane Center says cones will contain the path of the storm center only 60 to 70 percent of the time" Sounds like the communications fix is easy. Increase the uncertainty to 90-95% which also increases the cone size. And make it blood red and tell anyone inside the red that they need to be prepared. "Hurricanes are also hundreds of miles wide, and the cone shows only the possible path of the storm’s…

Something like this? https://www.nhc.noaa.gov/refresh/graphics_at5+shtml/025521.s...

I’ve only had to deal with one hurricane personally (Irma), and the forecast cone was only useful as an indicator to pay attention to the other, more detailed forecasts. As far as I’m concerned, it’s a relic from when weather forecasting models were much more primitive and graphics had to be reducible to B+W for printing.
Re: Misinterpreting hurricane forecasts

#92
post #89

I personally feel like the "spaghetti bundle" representation of the data (where a random sample of potential paths are drawn) was the most straightforward image of the uncertainty embedded in the forecast. Has it been considered as a means of public communication?

I've just implemented this in Flowx[1], the Android weather app I develop.

I have the "spaghetti bundle" but it was a major improvement when I added dots indicating the location of the hurricane center with time, as shown in this YouTube video[2]

[1] https://play.google.com/store/apps/details?id=com.enzuredigi...

[2] https://www.youtube.com/watch?v=I46IJcnf_bY

Re: Misinterpreting hurricane forecasts

#93
post #92
post #89

I personally feel like the "spaghetti bundle" representation of the data (where a random sample of potential paths are drawn) was the most straightforward image of the uncertainty embedded in the forecast. Has it been considered as a means of public communication?

I've just implemented this in Flowx[1], the Android weather app I develop. I have the "spaghetti bundle" but it was a major improvement when I added dots indicating the location of the hurricane center with time, as shown in this YouTube video[2] [1] https://play.google.com/store/apps/details?id=com.enzuredigi... [2] https://www.youtube.com/watch?v=I46IJcnf_bY

BTW, these are ensemble models for the NOAA GFS (FV3) and CMC GDPS models. Ensemble models are where the starting conditions of weather simulation is perturbed slightly and the simulations re-solved. They do this 20-odd times and you end up with 20-odd tracks. So for both GFS and GDPS there will give 40-odd paths.

Sometimes, it can be interesting how the cluster of GFS tracks may differ from the GDPS tracks.

Re: Misinterpreting hurricane forecasts

#94
post #49

Earlier quoted context omitted.

This is a great comment that accurately (and nonsensationally) depicts what it’s like to live/grow up in a hurricane area.

Thank you. I will say that we are relatively lucky in that we live inland, so we didn't have to worry about storm surge, in a newer suburb that had its power lines underground. We maybe lost 20 minutes of power during Wilma. I have family that lives in East Ft. Lauderdale, they were out of power for two weeks.

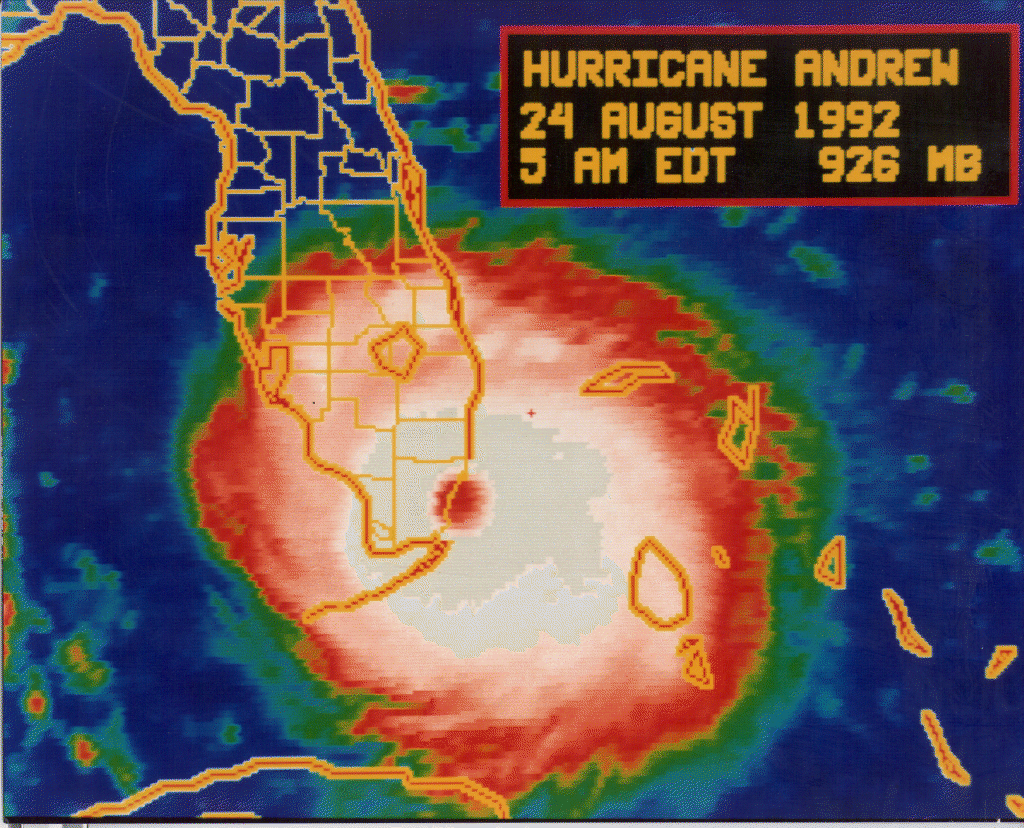
I was in Miami, Coral Gables specifically, for this guy:

https://www.nhc.noaa.gov/gifs/1992andy1.gif

I hope you never have to live through one of those. Not fun. Good luck with Dorian.

Re: Misinterpreting hurricane forecasts

#95
post #25

This article is a little bit misleading, unless I am misinterpreting his pictures. But that would be horrible for an article trying to explain pictures. Here is the graphical archive for all 5 day forecasts of Irma: https://www.nhc.noaa.gov/archive/2017/IRMA_graphics.php?prod... Now note the image that the article depicts for Hurricane Irma with this text: "These misunderstandings have real-world consequences. As Hur…

Hi Jsight, Alberto Cairo here. I wrote the piece, but didn't design the maps, so I'll ask. In any case, even if there's an inconsistency between the maps in the piece—which are intended to be illustrative, I guess—and the NHC ones, it doesn't undermine, I think, the overall message, which is that, regardless of whether you are inside of the cone or outside and close to it, it's safer to prepare just in case. People s…

Having been raised in Florida, you live through so many which are hyped up and so many of them end up missing or diverting away from the state altogether that people get cocky about it. Getting hit by the eye of the hurricane is much different than getting hit by the outer bands or even the middle core of it. The strongest winds are near the eye. The rest of the storm can still do rain and wind damage but it's nowhere near as bad, so it's easy to fall in to false sense of security. That being said, it's also easy to over-worry.

Re: Misinterpreting hurricane forecasts

#96
It's the first time I see this kind of graphic, but that cone looks very suspiciously narrow and smooth, especially in the later days.

Are they really properly compounding the probabilities here? Like to create the boundary for the second day you have to sample a number of possible positions from the first day, recompute a possible path from these samples, and then expand the area out of these forwarded samples, based on uncertainty. The boundary at day 2 should be related to the samples that went the most off course.

It looks like they just restart from the best-guess predicted position for day 2 which is already based on a prediction for day 1, and multiply it with the uncertainty, with a factor to account for one passing day. If that's the case this is really misleading. I imagine if they did it the way I'm thinking the cone could get very large very fast, but most importantly it wouldn't be smooth and symmetrical like this.

Re: Misinterpreting hurricane forecasts

#97
Three main misinterpretations:

1) Getting bigger over time.

2) Safe outside the cone.

3) Further from centre implies less preparation required.

1) Is maybe true anyway? I have no idea. Is it an important error?

2) Is more of a problem with the chart than the people. There's a hard border. It implies 95/99.7% confidence instead of 68%. Were the graph more intuitively designed, the interpretation would not be wrong, really, insofar as one maps probability to a binary choice.

3) Seems completely logical - the expected threat is lower further from the centre. People are still underestimating the risk, but for the same reason as 2).

Re: Misinterpreting hurricane forecasts

#98
post #84
post #39

Earlier quoted context omitted.

I've been living with hurricanes my entire life, and have been through many (the largest was Hugo in '89). The problem with all these cones is when they extend them beyond 72 hours. At that point, if we used your suggestion, the entire east coast could be in the cone. That means either no one pays attention, or everyone evacuates and next time ignores the warnings. What officials (and the news) need to do is tell eve…

> My personal rule to consider evacuating is a cat 4+ As you know well having lived through Hugo, the S/S category pertains to the wind speed. However, it's the flooding and storm surge, not the wind, that are by far the most deadly features of a hurricane. I'd be much more wary of a big, slow moving cat 2 arriving right at high tide and full moon than I would be a small, fast moving cat 4 arriving at low tide and a…

Note for the record that large tides (spring tides) are associated with full moon and new moon. Smaller tides (neap tides) are associated with half moons.

Re: Misinterpreting hurricane forecasts

#99
post #25

This article is a little bit misleading, unless I am misinterpreting his pictures. But that would be horrible for an article trying to explain pictures. Here is the graphical archive for all 5 day forecasts of Irma: https://www.nhc.noaa.gov/archive/2017/IRMA_graphics.php?prod... Now note the image that the article depicts for Hurricane Irma with this text: "These misunderstandings have real-world consequences. As Hur…

Here is the current hurricane: https://www.nhc.noaa.gov/archive/2019/DORIAN_graphics.php?pr...

Re: Misinterpreting hurricane forecasts

#100
post #84
post #39

Earlier quoted context omitted.

I've been living with hurricanes my entire life, and have been through many (the largest was Hugo in '89). The problem with all these cones is when they extend them beyond 72 hours. At that point, if we used your suggestion, the entire east coast could be in the cone. That means either no one pays attention, or everyone evacuates and next time ignores the warnings. What officials (and the news) need to do is tell eve…

> My personal rule to consider evacuating is a cat 4+ As you know well having lived through Hugo, the S/S category pertains to the wind speed. However, it's the flooding and storm surge, not the wind, that are by far the most deadly features of a hurricane. I'd be much more wary of a big, slow moving cat 2 arriving right at high tide and full moon than I would be a small, fast moving cat 4 arriving at low tide and a…

Absolutely agree on the flooding angle being the biggest danger. It's why I mentioned that people need to be aware of their personal situation.
Post reply on HN