Live data from Hacker News

Mapping the U.S. By Property Value Instead of Land Area

citylab.com

161–170 of 173 posts

Re: Mapping the U.S. By Property Value Instead of Land Area

#161
While it looks extremely cool, is this really the best way to visualise this data?

Every method of visualisation has its strengths and pitfalls. One of the pitfalls of this method is that it always looks rather dramatic, regardless of the data. Changing the shape of well-known things gives an uneasy feeling, regardless of what you map.

Only data that is perfectly equal will not result in arbitrary distortions. The amount of distortion, magnitude of the local scale factor, is (or should be) a parameter of the visualisation, just like the decision of using a fiery red-yellow colour gradient.

Linked source has a bit more info on what exactly they did. Which is simply substituting area for value in dollars. Only makes sense if the data somewhat follows a normal distribution. And I'm going to guess here, property value does not, at all. It's not even bounded. I'd have picked log value, because an exponential distribution for the value is a much more reasonable assumption.

In case of a visualisation like this, I might actually decide to do something that is generally frowned upon: change the "origin" of the data. That is, add some constant value to the scale factors, to smooth out the severity of the distortions a little. If I were mapping the log value that wouldn't be necessary since it'd be equivalent to scaling dollar values to $1000 or $1M, etc.

I'm trying to remember other examples where data was mapped to local scale in a non-shape preserving way.

The only thing I can come up with was a sort of homunculus visualisation (I forget if it was just a drawing or actually made into a 3d clay statuette). It scaled our body parts roughly proportional to the volume of our brain dedicated to it. So you'd get a giant head with huge bulging eyes, etc. It looked weird, funny, still somewhat human/cartoonish. It showed things as "this is MUCH bigger than that" or "huh I didn't realise my tongue was that important". It wasn't a very clear visualisation, but I'm also hard pressed to come up with a better way to do it.

In other words, this type of visualisation helps to show the data in a mostly qualitative way, not quantitative. And like the homunculus example, the data doesn't need to be super exact (we can't estimate relative area/volume of irregular shapes very well).

But it looks cool.
Re: Mapping the U.S. By Property Value Instead of Land Area

#162

> "The stubborn unwillingness of incumbent homeowners in highly productive places—namely San Francisco and New York City, which are barely visible on the land-area map, but dominate the housing value map—is a huge drain on the nation’s economy." Are they trying to say that if people didn't have to spend as much on housing then there would be greater GDP?

Maybe that's what they are saying. I could understand this wrong but high real estate prices locks up a lot of wealth in property where it isn't really doing any good. If all that wealth was able to circulate in the economy, it might increase growth. You might argue that when I buy a house for $500k, the seller gets $500k, so where's the problem? But the seller needs somewhere to live too- they are probably putting t…

That implies that all the cash is getting sunk into a new place, which is typically not the case.

Typically, I'm only putting 20% of that $500k down on the property. Now, to be fair, that $100k is effectively mothballed unless I pull it out with an equity loan or somesuch, but that's a far cry from freezing $500k.

Re: Mapping the U.S. By Property Value Instead of Land Area

#163

Earlier quoted context omitted.

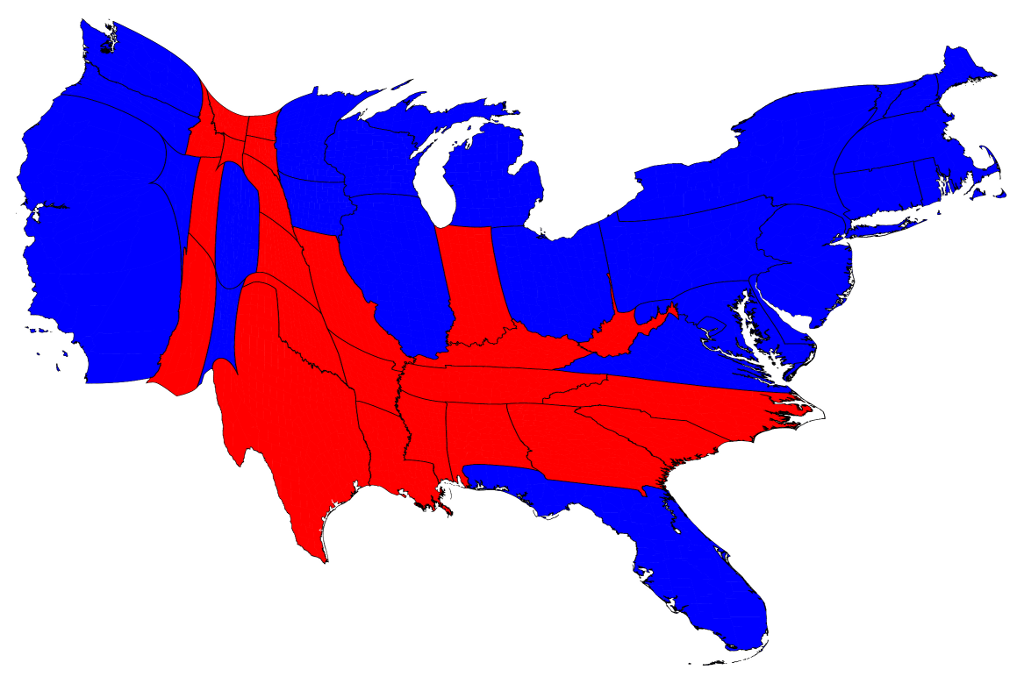
This is electoral votes per county, which is close to being population-weighted. What you'll find is that it's more moderate than the land-value cartogram, especially on the West Coast and Florida. Land values trend similarly to population densities, but actually exceed them. http://www-personal.umich.edu/~mejn/election/2008/countycart...

Electoral votes per county isn't really all that close to population-weighted; electoral votes are not apportioned proportionally to population.

Given that the data are by county and electoral votes aren't allocated on a county basis I'm going to walk back from what I wrote. The source isn't clear on basis though I suspect it's actually population.

Re: Mapping the U.S. By Property Value Instead of Land Area

#165
post #102

Earlier quoted context omitted.

population density . Iowa is huge, those 3 million people are pretty spread out

https://en.wikipedia.org/wiki/Santa_Barbara_County,_Californ... only has a population density of 110/sq mi yet it's huge on that map. For comparison the 'low density' Iowa has Des Moines, Iowa with a population density of 2,515.6/sq mi. PS: https://en.wikipedia.org/wiki/Los_Angeles_County,_California is a huge blob and only has 2,100/sq mi.

Why are you comparing Santa Barbara county to the city of Des Moines?

Des Moines is in Polk county with a density of 751/sq mi.

Anyways, I was just pointing out that your answer of "no b/c Iowa has 3 million people" has nothing to do with population density as the question posed.

Re: Mapping the U.S. By Property Value Instead of Land Area

#166
post #102

Earlier quoted context omitted.

https://en.wikipedia.org/wiki/Santa_Barbara_County,_Californ... only has a population density of 110/sq mi yet it's huge on that map. For comparison the 'low density' Iowa has Des Moines, Iowa with a population density of 2,515.6/sq mi. PS: https://en.wikipedia.org/wiki/Los_Angeles_County,_California is a huge blob and only has 2,100/sq mi.

Why are you comparing Santa Barbara county to the city of Des Moines? Des Moines is in Polk county with a density of 751/sq mi. Anyways, I was just pointing out that your answer of "no b/c Iowa has 3 million people" has nothing to do with population density as the question posed.

Why are you comparing Santa Barbara county to the city of Des Moines?

Size on the map is calculated as the sum (property value).

If we chose Des Moines to arbitrarily be a county then its population density would be really high, but it would be an even smaller chunk on the map.

Sure, you might be able to get a reasonable approximation of that map from: population * population density per mile, but population density on its own is not going to get there.

PS: As to why I said mentioned the population of Iowa in the first place, XKCD was a map of population per area. If you scale the map based on population and ignore area then it's just a population map. http://www-personal.umich.edu/~mejn/election/2012/statepop10... Note the west coast is 1/2 the size of the east cost, and texas is about the size of california.

Re: Mapping the U.S. By Property Value Instead of Land Area

#167
post #152

Earlier quoted context omitted.

No, I'm simply not making the mistake of taking my own conclusions and assuming the author is making THAT point. Whether you are right or not, it's not the authors point with that line. NIMBY was the point. As for whether you are right, you might think this personal mobility v capital mobility is a clever sounding point. It's dumb. The idea that one simple idea has led to concentrations of wealth is absurd. It's usef…

> It's useful in life to actually think things through, rather than parrot phrases you've heard in econ 101. You are literally clueless. Personal attacks are not allowed on Hacker News. Please don't do this again. https://news.ycombinator.com/newsguidelines.html

There is nothing in this link about personal attacks. "Be civil" is as close as it gets. "you're thinking too narrowly" is only slightly less civil than "You are literally clueless", which is something people say, face to face (see the bit after being civil?), frequently.

Re: Mapping the U.S. By Property Value Instead of Land Area

#168
post #156

Earlier quoted context omitted.

Really nice piece. I basically moved from SF to Boulder (with stops abroad in between). What you're talking about in the blog is playing out right now with the "make growth pay it's own way". http://openboulder.org/ob-opposes-two-growth-related-ballot-... They are smart people spearheading these anti-growth measures. They want (like you said) the Boulder from 30 years ago. They are motivated, smart, and have the time…

"There's little to no culture or character or funkiness here" Oh come on - it will always be the birthplace of Illegal Pete's, right ?

That's a burrito shop.

Re: Mapping the U.S. By Property Value Instead of Land Area

#169
post #152

Earlier quoted context omitted.

> It's useful in life to actually think things through, rather than parrot phrases you've heard in econ 101. You are literally clueless. Personal attacks are not allowed on Hacker News. Please don't do this again. https://news.ycombinator.com/newsguidelines.html

There is nothing in this link about personal attacks. "Be civil" is as close as it gets. "you're thinking too narrowly" is only slightly less civil than "You are literally clueless", which is something people say, face to face (see the bit after being civil?), frequently.

Personal attacks are the height of incivility.

Re: Mapping the U.S. By Property Value Instead of Land Area

#170

Earlier quoted context omitted.

Dark brown hair?

Unless you're counting hair dye, this will still leave out nearly 100% of China and India. You want brown eyes, or black hair. Grain consumption levels should track population pretty well across the world.

Grain consumption will vary by local industry. Livestock and biofuels consume more than humans do.
Post reply on HN