Live data from Hacker News

Mapping the U.S. By Property Value Instead of Land Area

citylab.com

141–150 of 173 posts

Re: Mapping the U.S. By Property Value Instead of Land Area

#141
post #131
post #4

> The demand to live in these places is soaring, but the desire among incumbents to accommodate newcomers is low Sums up why we ended up in Bend, Oregon rather than Boulder, Colorado. In the latter, there is a small but significant group of people whose idea is that the area needs fewer jobs, not smarter housing. Edit: http://journal.dedasys.com/2015/06/18/boulder-colorado-vs-be... - more about our choice, for the cu…

Bend is lovely. I'm curious, what was it like finding a place to live? Bend is somewhat notorious right now for it's <1% rental vacancy rates, which may be the lowest in the country. There was a news story earlier this year about a local medical center's new hires having a hard time finding a place to live -- I think one person even gave up and left their job because of it.

It was tough: especially since we have kids and wanted to make sure my daughter is in a good school.

OTOH, it's still a lot cheaper than Boulder, meaning hundreds of extra dollars a month in our pockets. And the place we did end up with is very nice.
Re: Mapping the U.S. By Property Value Instead of Land Area

#143
post #65

Earlier quoted context omitted.

If you follow the one of the links in the story, you'll see that one of the reasons the housing prices in NYC and SF are so high is the unwillingness of current residents to allow more construction to allow greater housing density. So, in this case, it isn't a proxy for population density since the high prices are actually a symptom of below-optimal population density.

That doesn't quite follow since SF and NYC are already the highest population densities in the US. The fact that the residents don't want to allow greater densities doesn't invalidate the correlation.

The densest part of Chicago is approximately as dense as SF, but isn't so astronomically expensive.

Re: Mapping the U.S. By Property Value Instead of Land Area

#144

Earlier quoted context omitted.

You're thinking too narrowly. Your point is correct, but the broader point is that there should be those same work opportunities spread out around the country so that you don't have to move to SF or wherever to get a good job. That is what hurts the economy on a broader scale. Employment is "sticky" in that personal mobility can't move as fast as capital mobility and that seems to have led to concentrations of wealth…

Network effects generally mean that the sort of work opportunities you see in SF or New York or Boston can't be spread around the country. EDIT: Heck, industrial network effects of the sort you saw in Pittsburgh and Detroit and now see in Shenzhen can't be spread around either.

Right, and stated as much in my original reply.

Re: Mapping the U.S. By Property Value Instead of Land Area

#145
Awesome idea! If they could make it less ugly, I would prefer standardizing on this as a way to plot geographic data in certain cases.

Graphing by land area often means spending huge chunks of the map where nothing (relevant to a particular purpose) happens, and cramming all the interesting stuff into a few places on the coasts.

(Note all the hedges and caveats; I don't want to trivialize anyone's home here, but we definitely see this effect a lot.)

Re: Mapping the U.S. By Property Value Instead of Land Area

#147
post #8

Isn't this just the same as population density? I think there's an XKCD about this ... https://xkcd.com/1138/

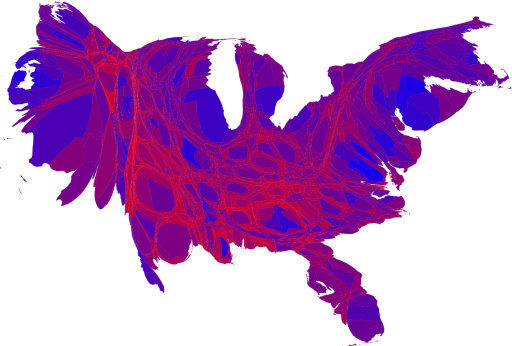
This is electoral votes per county, which is close to being population-weighted. What you'll find is that it's more moderate than the land-value cartogram, especially on the West Coast and Florida. Land values trend similarly to population densities, but actually exceed them.

http://www-personal.umich.edu/~mejn/election/2008/countycart...

Re: Mapping the U.S. By Property Value Instead of Land Area

#148
post #56

Earlier quoted context omitted.

Not quite fair. Usually the xkcd syndrome is caused by plotting density of something that is intrinsic to people e.g. red hair. You end up with a heatmap of population. Here, land prices may be higher because more people are there bidding up the prices. But its not a direct property of the individuals. So the heatmap effect is indirect. Maybe not big point, but there it is.

This map is measuring the land value within a county. Land values are dependent on population density. It's not surprising that Manhattan has such a high value when you consider how many folks are crammed into the island. If you create a map that was land value divided by population density it would be much more interesting.

Land value in general goes up with population density.

Re: Mapping the U.S. By Property Value Instead of Land Area

#149
post #66
post #8

Isn't this just the same as population density? I think there's an XKCD about this ... https://xkcd.com/1138/

Not quite... If that were so, you'd expect Texas to be visibly bigger than Florida (27M vs. 20M), but their area in the distorted land value map appears to be about the same.

Florida is much more likely to have "exiles" from more expensive regions of the Northern Atlantic Seaboard living there, driving up prices. You'll have wildly varying prices not that far apart in Florida.

Re: Mapping the U.S. By Property Value Instead of Land Area

#150
post #65
post #8

Isn't this just the same as population density? I think there's an XKCD about this ... https://xkcd.com/1138/

If you follow the one of the links in the story, you'll see that one of the reasons the housing prices in NYC and SF are so high is the unwillingness of current residents to allow more construction to allow greater housing density. So, in this case, it isn't a proxy for population density since the high prices are actually a symptom of below-optimal population density.

Look up the work of Geoffrey West at the Santa Fe Institute on cities and total economic activity (which scales with land values) by population.

As you increase populations (and population densities), cities become more economically active.

http://www.nytimes.com/2010/12/19/magazine/19Urban_West-t.ht...

After two years of analysis, West and Bettencourt discovered that all of these urban variables could be described by a few exquisitely simple equations. For example, if they know the population of a metropolitan area in a given country, they can estimate, with approximately 85 percent accuracy, its average income and the dimensions of its sewer system. These are the laws, they say, that automatically emerge whenever people “agglomerate,” cramming themselves into apartment buildings and subway cars. It doesn’t matter if the place is Manhattan or Manhattan, Kan.: the urban patterns remain the same. West isn’t shy about describing the magnitude of this accomplishment. “What we found are the constants that describe every city,” he says. “I can take these laws and make precise predictions about the number of violent crimes and the surface area of roads in a city in Japan with 200,000 people. I don’t know anything about this city or even where it is or its history, but I can tell you all about it. And the reason I can do that is because every city is really the same.”

Post reply on HN