If you zoom in, it gets lighter. That's unexpected, and seems to be an error in their averaging code. Maybe it's not averaging using HSV but in RGB?
The Racial Dot Map: One Dot Per Person for the Entire U.S.
101–110 of 122 posts
Re: The Racial Dot Map: One Dot Per Person for the Entire U.S.
#102Earlier quoted context omitted.
That is because hispanic is not a separate race according to the census it is an ethnicity. There are white hispanics and black hispanics, etc.
I understand and reject that reasoning. When you're mapping diversity, put me and my pasty-white Anglo-Dutch ancestry and my neighbors who grew up in Mexico in different categories.
And that is your right, you can make your own map, the census is freely available. It isn't a 'diversity' map, it is a map showing census data for race, income, household size and age, not ethnicity.
Re: The Racial Dot Map: One Dot Per Person for the Entire U.S.
#103Earlier quoted context omitted.
This difference changes the culture greatly Hence the importance of liberty as an axiom of federal governance: one group with particular cultural interests (say, deep urban) should not impose their situation-specific views on others far away with radically different cultural interests (say, rank wilderness). What some may find need to prohibit in one situation, others may find necessary to survival in another. The la…
Very true. Sadly, the reality of the structure of our government is such that rural areas have a greater representation in our governance than denser more urban areas.
Us rural types find the reverse practically true, even with representation explicitly skewed in our favor: urban centers regularly out-vote us by a long shot.
Re: The Racial Dot Map: One Dot Per Person for the Entire U.S.
#104As expected, you can see 5 green dots at 1600 Pennsylvania Ave in DC. Is there anywhere else that we can do better at tying dots to individuals?
Who's the fifth?
Re: The Racial Dot Map: One Dot Per Person for the Entire U.S.
#105Very cool looking. Now I can show my NY friends how diverse Denver really is and why there is a great multicultural food scene.
It's interesting to note: in the late 1960s Denver was quite segregated. A 1974 Supreme Court decision led to students being forced to ride the bus across town to mix with students of other races (I rode from southwest Denver to Five Points for a few years in elementary school.) One of the major results was white families moving out of the Denver city limits. They ended forced busing in 1995. Denver now has one of th…
Wow, thanks for this bit of history. I learned a few things about my town today!
Re: The Racial Dot Map: One Dot Per Person for the Entire U.S.
#106Earlier quoted context omitted.
I understand and reject that reasoning. When you're mapping diversity, put me and my pasty-white Anglo-Dutch ancestry and my neighbors who grew up in Mexico in different categories.
And that is your right, you can make your own map, the census is freely available. It isn't a 'diversity' map, it is a map showing census data for race, income, household size and age, not ethnicity.
> "you can make your own map"
or use the one in the original post. I'm just clarifying why I prefer that map over the one you linked to.
Re: The Racial Dot Map: One Dot Per Person for the Entire U.S.
#107I wish maps like this would label in which order they draw the dots. It makes a difference. This one, for instance, appears to draw (bottom up) "White", "Black", "Hispanic", "Other", "Asian" - this over-represents the races higher up on the list, especially in densely populated areas. That solid block of red? It probably has other colors underneath, but you can't see them, and they don't tell you this . This is one o…
Even better, why not just let people enable/disable the ethnicities? Could even make it so it draws the most recently enabled race on top of the rest. I'm trying to get an idea for where each ethnicity lives and it would be so much easier if I could just look at one at a time.
Re: The Racial Dot Map: One Dot Per Person for the Entire U.S.
#108I wish maps like this would label in which order they draw the dots. It makes a difference. This one, for instance, appears to draw (bottom up) "White", "Black", "Hispanic", "Other", "Asian" - this over-represents the races higher up on the list, especially in densely populated areas. That solid block of red? It probably has other colors underneath, but you can't see them, and they don't tell you this . This is one o…
Even better, why not just let people enable/disable the ethnicities? Could even make it so it draws the most recently enabled race on top of the rest. I'm trying to get an idea for where each ethnicity lives and it would be so much easier if I could just look at one at a time.
Yeah, I've seen a rare few that offer this, though usually not re-arranging which are on top. It's usually surprising just how biased the default display is :\
That said, it still surprises me that these map makers (all of them! not just this one) don't take the simpler approach of drawing all dots in a random order - e.g. get rid of this "first all blue dots, then green, etc" behavior, and pick the next dot's color randomly, while maintaining the distribution. Then you'd have an unbiased "top layer" regardless of the size of your dots (up to a point, obviously).
(hard to describe what I'm thinking of... basically `[red, red, ... * 25, green, green, ... * 10, orange, orange].shuffle.draw` rather than just `[].draw`)
Re: The Racial Dot Map: One Dot Per Person for the Entire U.S.
#109Earlier quoted context omitted.
I think the kinds of people who engage in gang violence or monetary crimes over drugs fit into the category of "bad, antisocial" people I mentioned. Society would have to deal with their proclivities whether or not their energies were directed towards illegal drugs or something else.
That's quite an amazingly strong claim of biological essentialism. Got any data to back it up? It would be naive to imagine that there is no "fundamental nature" element to people. That your genes or early childhood experiences or whatever do not make some people more prone to antisocial behavior, and indeed do not make some people guaranteed to be extremely antisocial. Some people who are now criminals connected wit…
There is something very important missing in your "nature vs. nurture" worldview, which is: people can and do think for themselves and thereby determine their own values.
For instance, you attribute the grandparent's point of view to "biological essentialism." The grandparent said no such thing. He said: certain people are prone to crime. That is true. Those people are acting out their values and their ideas about the world and about how they can best survive and cope within it. I don't agree that everyone who is a drug criminal would necessarily find some other avenue of crime, but to suggest that they would is not a claim to biological essentialism.
> A hundred and sixty years ago, millions of people in the United States actively participated in a monstrous crime perpetrated against an entire race of people, the equivalent of what in the modern world would be multiple felonies per day across their lifetimes. It was certainly antisocial. Was that destiny? Were all those people just inherently bad? If so, what happened to them? Why doesn't modern Georgia have most whites being serial felons?
What happened is the spread of ideas about human rights from the Enlightenment. Slavery has been the norm for 99% of human history. The Southerners you talked about just didn't have the great newfangled idea of people having rights. That was a real intellectual achievement that took humans thousands of years.
Re: The Racial Dot Map: One Dot Per Person for the Entire U.S.
#110Earlier quoted context omitted.
I think the kinds of people who engage in gang violence or monetary crimes over drugs fit into the category of "bad, antisocial" people I mentioned. Society would have to deal with their proclivities whether or not their energies were directed towards illegal drugs or something else.
That's quite an amazingly strong claim of biological essentialism. Got any data to back it up? It would be naive to imagine that there is no "fundamental nature" element to people. That your genes or early childhood experiences or whatever do not make some people more prone to antisocial behavior, and indeed do not make some people guaranteed to be extremely antisocial. Some people who are now criminals connected wit…
I'm not suggesting anything is biological. But the guy who has never had a real job other than crime isn't not a "bad, antisocial person" just because you can ascribe his condition to his circumstances growing up. Nor can you say that the drug war created those circumstances.[1] The drug war didn't create these insular low-income communities that don't trust the police. It didn't create households where fathers abandon their kids. It didn't create the vacuum of social authority in these communities that is filled by the gangs.
Say you end the drug war, legalize everything so you can go into Wal-Mart for a hit of heroin. What happens? The gang members driving around shooting each other aren't going to go get jobs (there aren't any). Heck, you might dry up a lot of what little income flows into these communities.
[1] Very interesting set of graphs: http://www.newclarion.com/wp-content/uploads/2011/01/homicid...; http://en.wikipedia.org/wiki/United_States_incarceration_rat...; http://quod.lib.umich.edu/h/humfig/images/11217607.0002.206-....


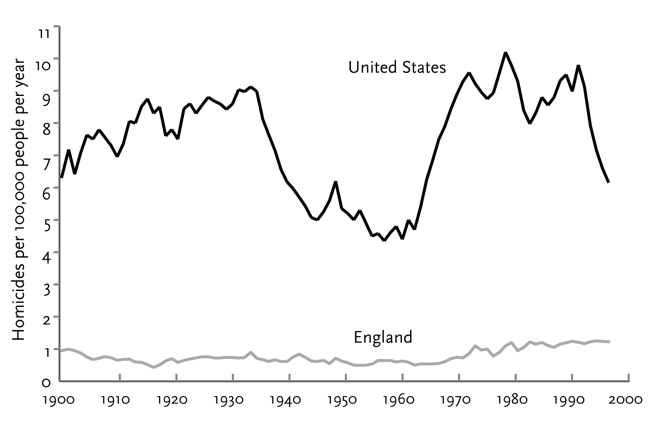
The first image is the number of homicides per capita. After hitting a minimum in the late 1950's, it starts increasing again in 1960. By the early 1970's, it's at historical highs (last seen in the 1930's). The second image is incarceration rate, which we can use as a proxy for the intensity of the drug war. Note how it's almost flat till about 1973-1974, and starts really increasing around 1975-1980. The third image is a comparison of America's murder rate to that of the U.K. Note how we have always been a dramatically more violent society throughout the entire 20th century.
The final thing to note is that the peak murder rates of the 1980's are similar to those of the 1930's. In other words, homicides went down dramatically in the 1940's and 1950's, but returned to their previous levels by the 1960's and 1970's. Don't be quick to ascribe the first peak to Prohibition, either. Prohibition lasted from 1920-1933. You can see it caused an increase in homicide rates, but the rate from 1900-1920 was already very high, and Prohibition didn't increase it that much relative to how much it went up from 1960 to 1980.
So what causes this pattern? Is it Prohibition or the Drug War? Or are those just relatively small effects on top of much larger phenomena? The social upheaval of the 1900's-1930's and of the 1960's to 1980's?