these charts are exceedingly pretty- i couldn't tell from the examples if there are things included to make them more interactive or not (hover info, zoom in and out etc)
Variance
11–20 of 56 posts
Re: Variance
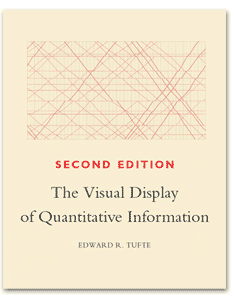
#12Looks great. The landing page reminds me of the cover of Tufte's "The Visual Display of Quantitative Information" (http://www.edwardtufte.com/tufte/graphics/vdqi_bookcover.gif).
Re: Variance
#13Nicely done. Some support for real-time updates would be a hit (using eg a firebase websocket URL as a data source, or a JSONP url for interval polling).
Re: Variance
#14these charts are exceedingly pretty- i couldn't tell from the examples if there are things included to make them more interactive or not (hover info, zoom in and out etc)
I too would like to know if anything is planned for built-in support for things like hover states, tooltips, etc, so that users can inspect/explore/drill-into the data shown in a Variance-powered chart.
Re: Variance
#15these charts are exceedingly pretty- i couldn't tell from the examples if there are things included to make them more interactive or not (hover info, zoom in and out etc)
I too would like to know if anything is planned for built-in support for things like hover states, tooltips, etc, so that users can inspect/explore/drill-into the data shown in a Variance-powered chart.
We have some stuff planned, but nothing on a firm timeline.
That said, remember that Variance was designed to embrace HTML and CSS. You want hover effects? Use a plain ol' CSS selector. If you want something more elaborate, you can definitely just throw some classes onto different parts of your visualization and use other JS libraries like Bootstrap's tooltips.
Re: Variance
#16This is written by Kevin Lynagh, known for his work on C2 (Like D3 in Clojure - http://keminglabs.com/c2/) and "A grammar for statistical graphics" (http://vimeo.com/53214578).
Re: Variance
#17Seems like a cool idea. A bit worrying that basically it just turns the data into xml.
Re: Variance
#18Why don't the charts plot he variance in the data?
Re: Variance
#19Looks great. The landing page reminds me of the cover of Tufte's "The Visual Display of Quantitative Information" ( http://www.edwardtufte.com/tufte/graphics/vdqi_bookcover.gif ).
My thoughts exactly. I have the book sitting on my desk right now!
Re: Variance
#20Note that it's not free (as in speech) software, nor is it free to use for commercial projects. Just a PSA, I don't think there's any point in discussing the pros and cons of that; not that I can stop anyone.