Live data from Hacker News

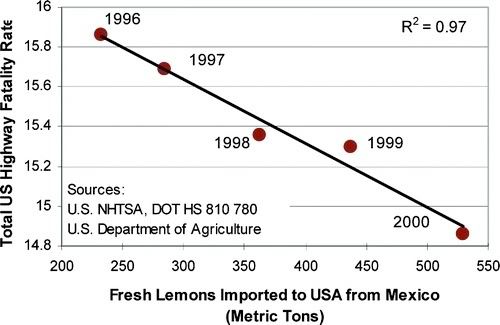
Misleading Graph Generator

yrden.de

11–20 of 37 posts

Re: Misleading Graph Generator

#11
post #3

How is this graphs fault? The only fault the graph has is that it clearly displays the data, the problem is in the idea that is represented. It's formally called "Correlation does not imply causation" and it's fault of the person who is suggesting it. There is a famous satirical version of this too: http://en.wikipedia.org/wiki/File:PiratesVsTemp(en).svg It has nothing to do with graphs, graphs are are just visual to…

>It's formally called "Correlation does not imply causation" and it's fault of the person who is suggesting it.

Well, correlation sure DOES imply causation.

In the dictionary sense of "imply", as: "suggested but not directly expressed; implicit".

What it does not is necessitate causation, but it sure as hell does imply it.

Re: Misleading Graph Generator

#12
post #10
post #9

Earlier quoted context omitted.

> (almost certainly due to a third common causal factor, of course). ..or absolutely certainly associated so remotely that correlation is purely accidental and found only by carefully cherry picking data sources, ranges, functions to massage the data (log with the right base) and axis ranges. To sum up ... not meaningful. You could find similar correlation between ocean temperatures and lottery numbers but you'd have…

"log with the right base" doesn't make any difference. That's a linear mapping. For instance: 2log x = log x / log 2 = ln x / ln 2 (With 2log the logarithm in base 2, log and ln the logarithm in bases you pick, but you can think of 10 and e) See, for example, http://www.purplemath.com/modules/logrules5.htm , or derive it from the axioms.

I think this ln2 factor matters when you are drawing a graph. But I guess that's included in what I called axis range.

Re: Misleading Graph Generator

#13
post #3

How is this graphs fault? The only fault the graph has is that it clearly displays the data, the problem is in the idea that is represented. It's formally called "Correlation does not imply causation" and it's fault of the person who is suggesting it. There is a famous satirical version of this too: http://en.wikipedia.org/wiki/File:PiratesVsTemp(en).svg It has nothing to do with graphs, graphs are are just visual to…

Another: http://i259.photobucket.com/albums/hh288/krispos42/Unsorted/...

Re: Misleading Graph Generator

#14
This isn't a graph generator. It's just a graph. You can plug data into it and get a graph, I guess, but the same goes for Excel.

A misleading graph generator that automatically matched concurrent data sets based on correlation would be quite interesting, but this isn't it.

Re: Misleading Graph Generator

#16
post #11
post #3

How is this graphs fault? The only fault the graph has is that it clearly displays the data, the problem is in the idea that is represented. It's formally called "Correlation does not imply causation" and it's fault of the person who is suggesting it. There is a famous satirical version of this too: http://en.wikipedia.org/wiki/File:PiratesVsTemp(en).svg It has nothing to do with graphs, graphs are are just visual to…

> It's formally called "Correlation does not imply causation" and it's fault of the person who is suggesting it. Well, correlation sure DOES imply causation. In the dictionary sense of "imply", as: "suggested but not directly expressed; implicit". What it does not is necessitate causation, but it sure as hell does imply it.

This is not true. Correlation means that there is some kind of relation between two variables(for example, how they change over time) but it says nothing about the mechanics of the relation, which is the causation.

Let me investigate this example:

the observation: Students who watch less TV have better grades.

It's not like pirates v.s. global warming, it actually makes sense at first and if you are the minister of education whose goal is to increase the grades among students and you don't have an idea about "Correlation does not imply causation" principle you may actually suggests to ban TV's to improve the education. You can even draw a fancy graph to support your idea.

However, after further investigation you may find out that this would not work because it's not the TV that is causing the lower grades. Maybe the better students tend to watch less TV because they prefer to read books instead of watching TV.

This time it may seem to suggests the opposite: Increasing the students success in school reduces the time the TV is watched. However after even further investigation you may find out that your better students are from poor families(maybe the schools in your country are accepting the best students without tuition and are not selective about these who can pay) that just don't have a TV set, or maybe these better students also need work part-time to support their families, thus they just don't have time for TV.

Thus, you can't really change one value by synthetically manipulating the other one. Turns out, the correlation did not meant causation.
Re: Misleading Graph Generator

#17
post #16
post #11

Earlier quoted context omitted.

> It's formally called "Correlation does not imply causation" and it's fault of the person who is suggesting it. Well, correlation sure DOES imply causation. In the dictionary sense of "imply", as: "suggested but not directly expressed; implicit". What it does not is necessitate causation, but it sure as hell does imply it.

This is not true. Correlation means that there is some kind of relation between two variables(for example, how they change over time) but it says nothing about the mechanics of the relation, which is the causation. Let me investigate this example: the observation: Students who watch less TV have better grades. It's not like pirates v.s. global warming, it actually makes sense at first and if you are the minister of e…

It's not like that. Correlation does not imply causation only in the strict meaning of "imply", =>, in mathematical logic. But correlation is sure as hell evidence for casual relationships. Just yesterday I found a blog post by author of "Think Bayes" book explaining that nicely.

http://allendowney.blogspot.com/2014/02/correlation-is-evide...

Moreover, with good enough correlation data, you can even determine the direction of casual relationship if you're willing to do a little bit of maths:

http://lesswrong.com/lw/ev3/causal_diagrams_and_causal_model...

Also, http://xkcd.com/552/ ;).

Re: Misleading Graph Generator

#18
For causation, you need A/B testing -- real A/B testing (randomized controlled experiments).

Not everyone understands the need for A/B testing and not everyone understands how to do A/B testing.

I recently worked on modeling to forecast revenues for a large multinational. One of the variables that was essential for an accurate model was whether prior data came from before or after the company hired their current A/B testing guru. With the new guru, revenues rose every week. With the previous "guru", changes by Engineering had no impact on revenues.

Re: Misleading Graph Generator

#19
post #16
post #11

Earlier quoted context omitted.

> It's formally called "Correlation does not imply causation" and it's fault of the person who is suggesting it. Well, correlation sure DOES imply causation. In the dictionary sense of "imply", as: "suggested but not directly expressed; implicit". What it does not is necessitate causation, but it sure as hell does imply it.

This is not true. Correlation means that there is some kind of relation between two variables(for example, how they change over time) but it says nothing about the mechanics of the relation, which is the causation. Let me investigate this example: the observation: Students who watch less TV have better grades. It's not like pirates v.s. global warming, it actually makes sense at first and if you are the minister of e…

Correlation does _suggest_ causation.

Re: Misleading Graph Generator

#20
post #9
post #8

Earlier quoted context omitted.

Yeah, I think this is completely off-base in blaming the axes. The axes are perfectly fine in showing the actual correlation that's present here (almost certainly due to a third common causal factor, of course). There's no really magically "unbiased" way of choosing axes. There seems to be a popular view recently that you should always start your axes at zero, I assume as a backlash to some graphs magnifying very sma…

> (almost certainly due to a third common causal factor, of course). ..or absolutely certainly associated so remotely that correlation is purely accidental and found only by carefully cherry picking data sources, ranges, functions to massage the data (log with the right base) and axis ranges. To sum up ... not meaningful. You could find similar correlation between ocean temperatures and lottery numbers but you'd have…

Actually, in this case I'd argue that a general/generic measure of "human scientific and technical advancement" is a decent underlying causal factor.

Maybe meaningful, if kind of obvious...

Post reply on HN