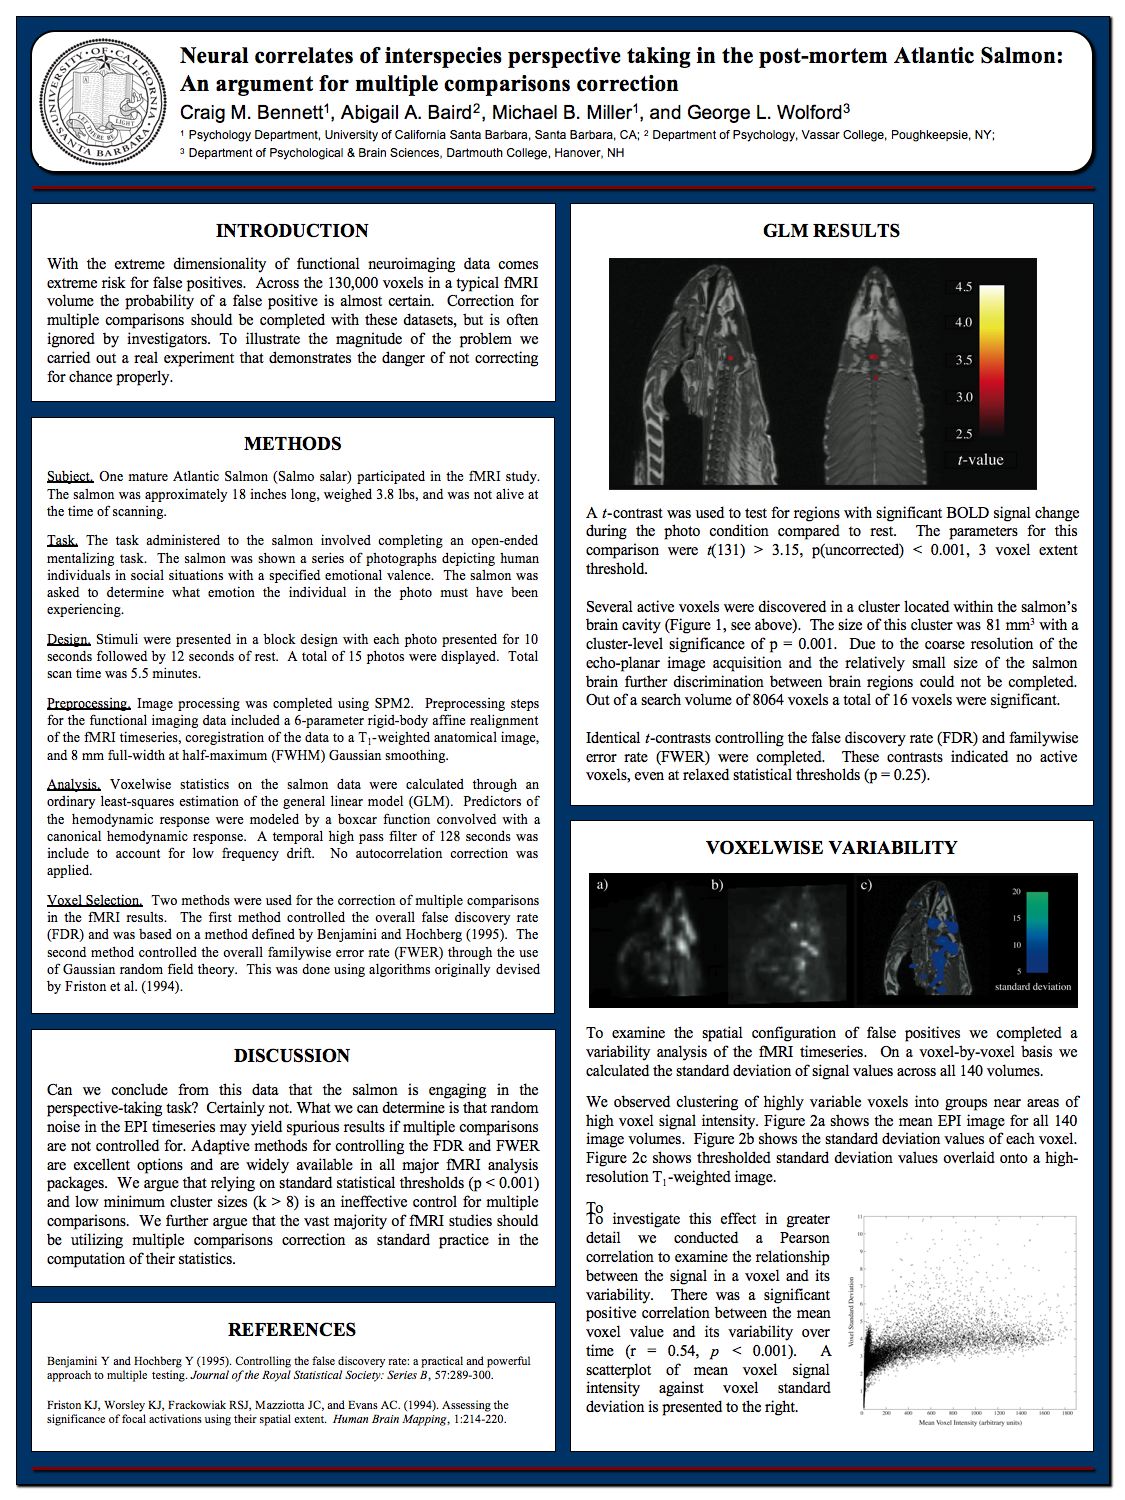
You are always going to be able to find trends between data points if you have enough information. In order to tell whether you actually have predictable information you need to do a double test, which they don't seem to mention anywhere.
Typically you split your data pool in half and use data analysis to determine some kind of relation, such as the change in "color" seems to correlate to a reverse change in DOW Jones. You then generate a prediction algorithm based on that.
Finally you use your prediction system on the other half of your data, to see if you are actually predicting or just correlating. Feel free to adjust any of your methodology but make sure you don't include the second half in your generation step or else you have only shown correlation not prediction.