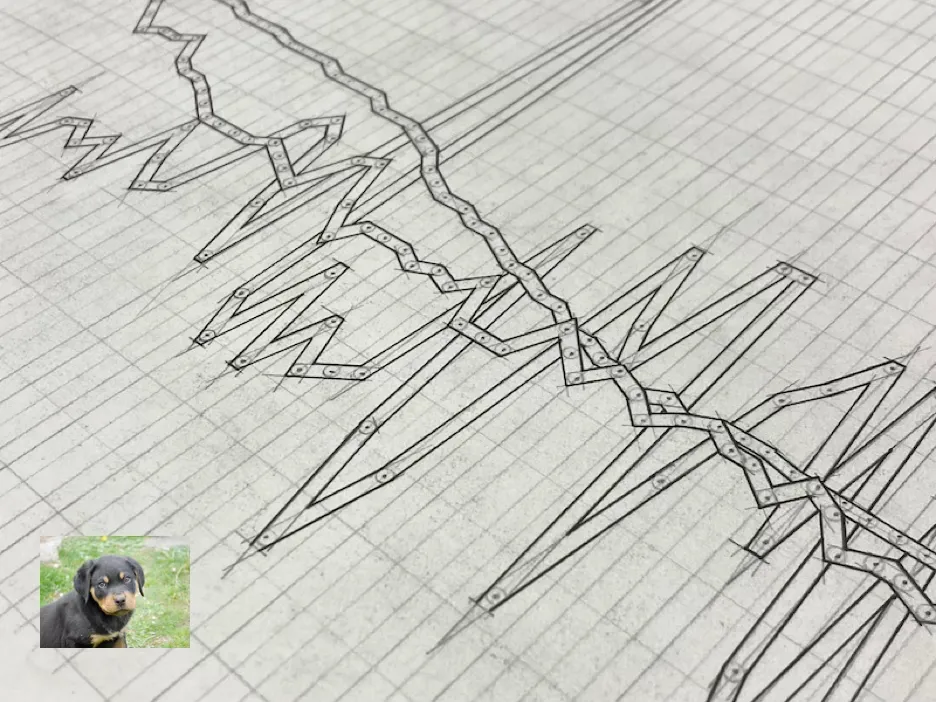
Graph paper FWT :)
I spent 50 hours drawing a line graph
31–40 of 118 posts
Re: I spent 50 hours drawing a line graph
#32I build furniture and while I do my design work digitally for remote clients, I do my shop drawings by hand.
One super helpful tip I got from an actual trained draftsman is to use harder pencil lead for your layout and construction lines. Like 6H to 9H. You'll get a much lighter line to erase later. It'll also hold a finer point for longer.
I prefer lead holders to wooden pencils. They take 2mm lead, and you sharpen them with a lead pointer. K&E pointers are readily available on eBay, as are the abrasive cups that do the actual sharpening. The plastic trash can ones will get the job done, but are unsatisfying from a tactile standpoint.
A decent lead holder is a trick to find. The Alvin one I bought is too loose and the lead slips up into it. The Staedtler one doesn't close tightly at the tip and support the lead well enough to prevent breaking. The Prismacolor one is satisfactory, and I inherited a vintage one that I love from the aforementioned draftsman.
I recommend an erasing shield to make revising your pencil work without erasing too much. Another person I know with an art background tipped me off to putting tracing paper over your main drawing to iterate on details before committing them to paper to reduce erasing.
Drafting vellum is pretty forgiving of erasing, but it has a toothier surface that can get a little dingy if you're working on a drawing for a while. I've never tried Bristol board; I don't need immaculate drawings for reproduction, just good enough ones to build from.
Happy drawing. It's an immensely satisfying process for me. If you're detail oriented, you'll likely find it enjoyable too.
Re: I spent 50 hours drawing a line graph
#33And your coffee-maker apparently still had all its coffee when it finally got back from from Russia!
(But the temperatures should have been recorded on the Réaumur scale.)
Re: I spent 50 hours drawing a line graph
#34Re: I spent 50 hours drawing a line graph
#35You should add in Calvin Schmid's Handbook of Graphic Presentation into your list Doug -- https://archive.org/details/HandbookOfGraphicPresentation/pa... Unfortunately I do not see specific discussion of how to make the lines a consistent thickness. It does have notes on how to sharpen your pencil and how to use a carpenters spline to draw smooth curves though.
> lines a consistent thickness
A "ruling pen" would help. It's like a fountain pen where you can adjust the width of the ink.
Re: I spent 50 hours drawing a line graph
#36Reminds me of https://www.dear-data.com/theproject
Re: I spent 50 hours drawing a line graph
#37[dead]
Re: I spent 50 hours drawing a line graph
#38This the most hackernews post I've ever seen. Doing something in 50 hours that could have taken 20 minutes because vibe.
I love it.
The peak irony is that most of us work in a field that exists so that people don't need to do that stuff for 50 hours.
Re: I spent 50 hours drawing a line graph
#39Amazing process (such patience in this day and age!), and special thanks for sharing links to the data viz books! Tufte was my gateway too but I didn’t think to look into books on technical sketching, engineering drawing, and draftsmanship. Love hand-drawn viz, recently I’ve been looking at the French National Institute of Statistics and Economic Studies (INSEE) and they have a great collection of all their reports,…
Thanks for the link to this archive. A very welcome contribution very a propos in relation to the article.
An amateur of old hand drawn maps (Michelin road, and older).
Re: I spent 50 hours drawing a line graph
#40Thanks, the article puts into perspective the Bret Victor's point about William Playfair, who invented many of the data diagrams we use today, including the line graph. It was strange to see something as basic to how we think about data was invented only in late 18th century. But seeing the amount of work you put to design them properly clarifies the amount of creative thinking that was required to get something like this going on.
I'd also wish more graphs would come with this level of detail as this image from the article [0]. It would be so useful to see precisely where the data points are and how the line and interpolation are constructed.
[0] https://www.dougmacdowell.com/images/hand-drawn-data-outline...