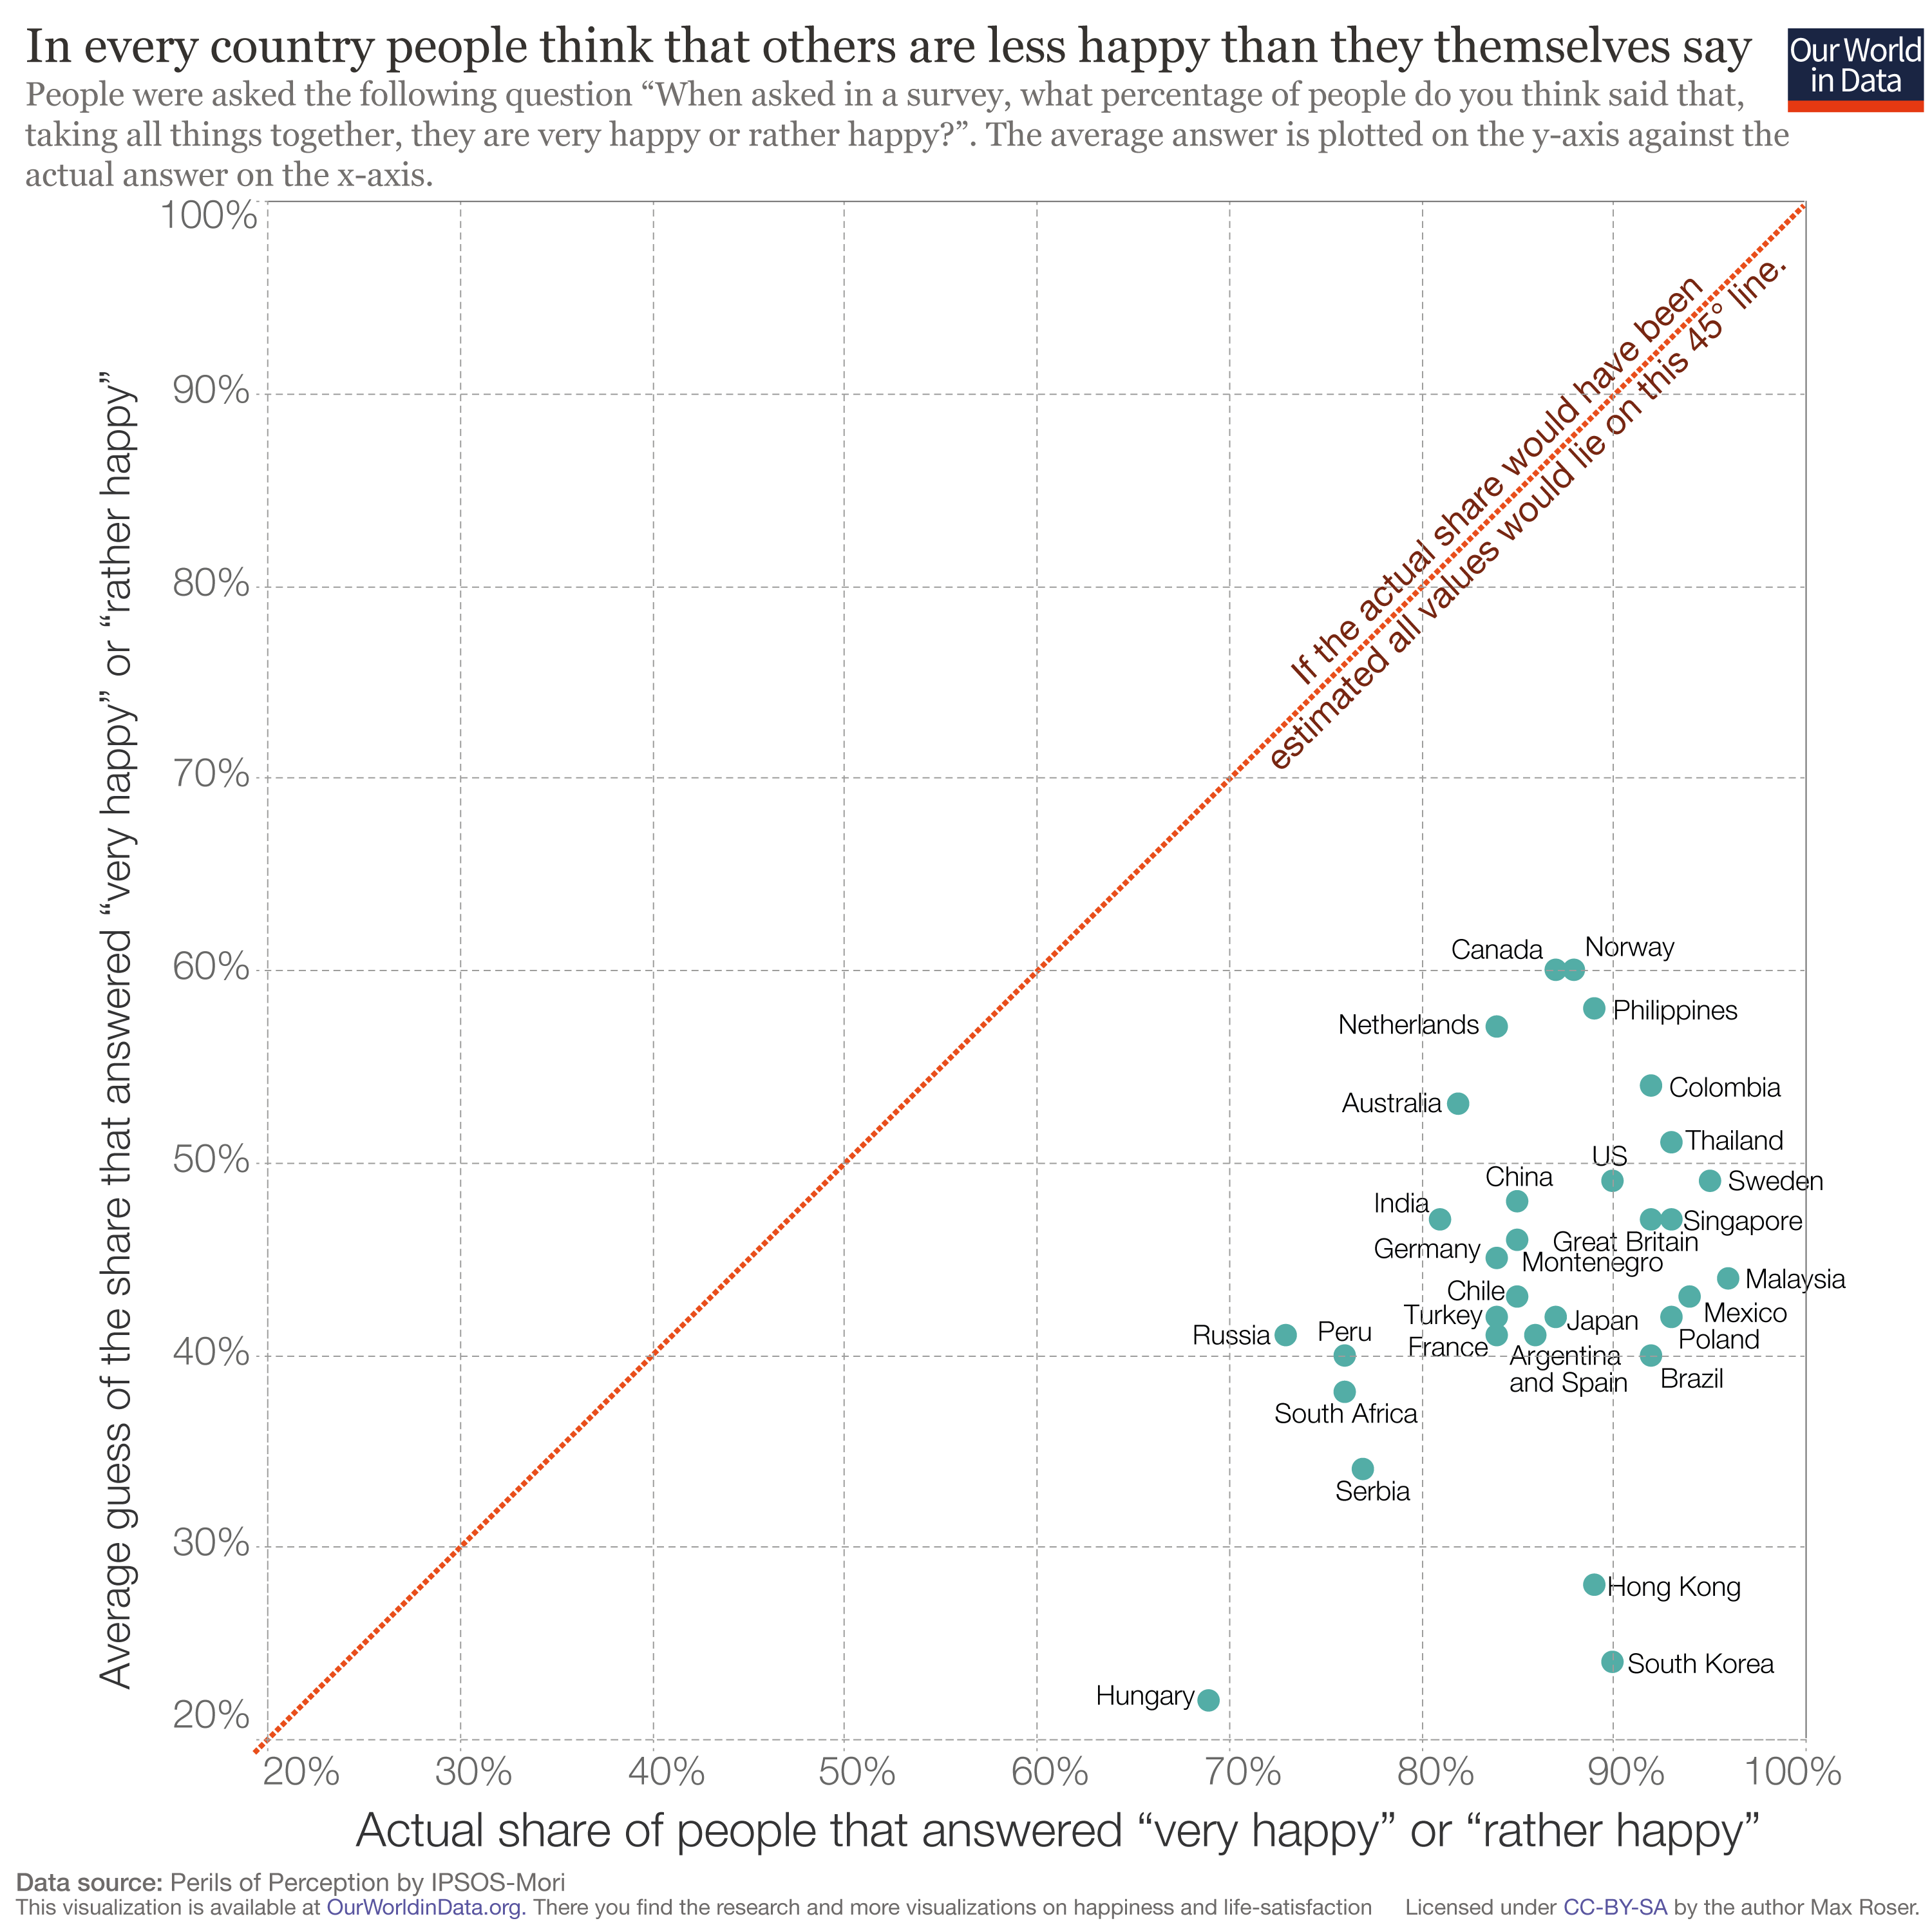
Explains some things about Hungary though
In every country people think others are less happy than they themselves say (2017)
11–20 of 103 posts
Re: In every country people think others are less happy than they themselves say (2017)
#12Re: In every country people think others are less happy than they themselves say (2017)
#13What’s wrong with Honk Hong and South Korea ? 90% says they’re very or rather happy and thinks only 20% of their peer does. I wonder if that’s linked to a cultural thing. Any Asian expert have an idea here ?
Re: In every country people think others are less happy than they themselves say (2017)
#14Not a very object measurement of happiness, especially without situational or cultural context.
Re: In every country people think others are less happy than they themselves say (2017)
#15Could someone help me understand this plot? What i guessed: 1. Participants were asked how happy they are. 2. After that they were asked about what percentage of people from /their own country/ would answer happy or very happy. 3. Plot XY of the ratio of people who answered happy or very happy (x axis) vs their average of the percentage of how this happy people estimate how many people answered like them (y axis). Di…
Yup, and it shows that most people are happy but still think that most other people are unhappy
Re: In every country people think others are less happy than they themselves say (2017)
#16they are all correct
Re: In every country people think others are less happy than they themselves say (2017)
#17is it definitional if you include in the definition of "happy" that you feel you are well off compared to others in your society? ie: if happiness is relative then you can't be happy unless you think others are less happy. Perhaps the trick of modern society is to convince most people, as individuals, that they are better off than average - even when logically that can't be true (putting aside differences b/w means and medians etc).
Re: In every country people think others are less happy than they themselves say (2017)
#18is it definitional if you include in the definition of "happy" that you feel you are well off compared to others in your society? ie: if happiness is relative then you can't be happy unless you think others are less happy. Perhaps the trick of modern society is to convince most people, as individuals, that they are better off than average - even when logically that can't be true (putting aside differences b/w means a…
Being happy because you think you are better off than some other people is definitely one kind of happiness but not the only one.
Re: In every country people think others are less happy than they themselves say (2017)
#19It looks like the data needs to be normalized? People might be assuming different thresholds of happiness, the same way the common response to "are you ok?" is yes, and continues to be yes until someone is absolutely miserable.
You lie in “are you ok?” interactions because you are talking with someone and there’s all kinds of considerations like “don’t want to lose face” and “don’t want to bother them”. You can be as candid as you want in an anonymous survey.
Re: In every country people think others are less happy than they themselves say (2017)
#20Could someone help me understand this plot? What i guessed: 1. Participants were asked how happy they are. 2. After that they were asked about what percentage of people from /their own country/ would answer happy or very happy. 3. Plot XY of the ratio of people who answered happy or very happy (x axis) vs their average of the percentage of how this happy people estimate how many people answered like them (y axis). Di…
[dead]