Actuarial Life Table
ssa.gov
Actuarial Life Table
1–10 of 62 posts
Re: Actuarial Life Table
#2If anyone is interested in more life tables the Society of Actuaries has thousands to download and there is some simple code to read them in Python here:
Re: Actuarial Life Table
#3I graphed the difference in years amongst men and women using good ol' fashioned awk and free graphing software:
It looks like at around age 18 - 30ish, the numbers start catching up, with a sharper reduction in expectancy differences happening around age 35.
From the PRB:
"Men are three times as likely as women to die from injuries (unintentional injuries, suicide, or homicide), and progress against those causes of death has been much slower than against other causes in the last 50 years. There is also evidence that men at all ages are less likely to seek medical care and less likely to comply with medical instructions than are women."
Re: Actuarial Life Table
#4I graphed the difference in years amongst men and women using good ol' fashioned awk and free graphing software: https://imgur.com/a/3b1KrD7 It looks like at around age 18 - 30ish, the numbers start catching up, with a sharper reduction in expectancy differences happening around age 35. From the PRB: "Men are three times as likely as women to die from injuries (unintentional injuries, suicide, or homicide), and progr…
I'm very interested in this workflow of data -> awk -> graph. What graphing software did you use?
Re: Actuarial Life Table
#5I graphed the difference in years amongst men and women using good ol' fashioned awk and free graphing software: https://imgur.com/a/3b1KrD7 It looks like at around age 18 - 30ish, the numbers start catching up, with a sharper reduction in expectancy differences happening around age 35. From the PRB: "Men are three times as likely as women to die from injuries (unintentional injuries, suicide, or homicide), and progr…
I'm very interested in this workflow of data -> awk -> graph. What graphing software did you use?
Well, I spat out the list of numbers and just googled "graph values" and took the first result, but if you love to stay in command line, you can do something like so...
# awk '{print $7-$4}' chart | gnuplot -p -e 'plot "/dev/stdin"'
Where `chart` is just what I copy and pasted from the site :)
Re: Actuarial Life Table
#6The death probability has a turning point from decreasing to increasing around age 10 for both male and female. Wonder why this specific age.
Re: Actuarial Life Table
#7The death probability has a turning point from decreasing to increasing around age 10 for both male and female. Wonder why this specific age.
The overlapping decreasing line curves of mortality due to infant / child mortality cases and increasing line curves of mortality due to external factors, accidents, and illnesses. The lines cross around 10 yrs old.
Re: Actuarial Life Table
#8The death probability has a turning point from decreasing to increasing around age 10 for both male and female. Wonder why this specific age.
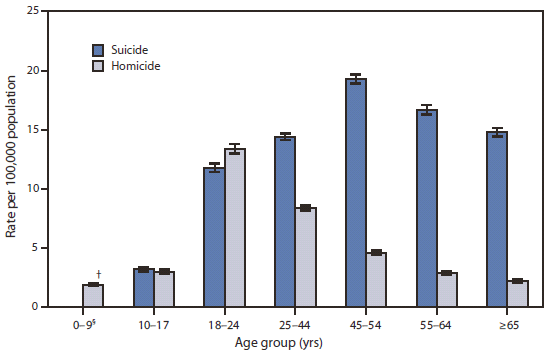
Probably not the only factor, but 10's about the age when suicide becomes more than a very, very remote possibility.
https://www.cdc.gov/mmwr/preview/mmwrhtml/figures/m6128qsf.g...
Re: Actuarial Life Table
#9The death probability has a turning point from decreasing to increasing around age 10 for both male and female. Wonder why this specific age.
Probably not the only factor, but 10's about the age when suicide becomes more than a very, very remote possibility. https://www.cdc.gov/mmwr/preview/mmwrhtml/figures/m6128qsf.g...
U.K. data but accidents and cancer exceed intentional self harm for teenagers.
https://stateofchildhealth.rcpch.ac.uk/evidence/mortality/ad...
Re: Actuarial Life Table
#10This data, unfortunately, is missing an important confounding variable besides male/female. In the US lifespan his highly correlated with income, and the trend is getting worse.
"The gap in life expectancy between the richest 1% and poorest 1% of individuals was 14.6 years (95% CI, 14.4 to 14.8 years) for men and 10.1 years (95% CI, 9.9 to 10.3 years) for women. Second, inequality in life expectancy increased over time. Between 2001 and 2014, life expectancy increased by 2.34 years for men and 2.91 years for women in the top 5% of the income distribution, but increased by only 0.32 years for men and 0.04 years for women in the bottom 5% (P [1] https://www.ncbi.nlm.nih.gov/pmc/articles/PMC4866586/