Live data from Hacker News

The Buffett Indicator

currentmarketvaluation.com

31–40 of 110 posts

Re: The Buffett Indicator

#31
post #24

Is Buffett indicator still relevant today with deep globalization? It does not take account of at least following factors: * Companies like BABA or SE that contribute little to US GDP. * Tech giants shift profits to low-tax countries. * Income from US only makes part of global giants' income. (I know almost nothing about economy so this is novice question, instead of a statement against the effectiveness of Buffett i…

I agree with this. Apple, a huge part of spy, does tens of billions of business outside the US. Most of the rest of the S&P 500 also. Using US GDP as a denominator is faulty when the stocks in the numerator are worldwide leaders. It’s a simplistic measure that I wouldn’t base my investments on.
Re: The Buffett Indicator

#32
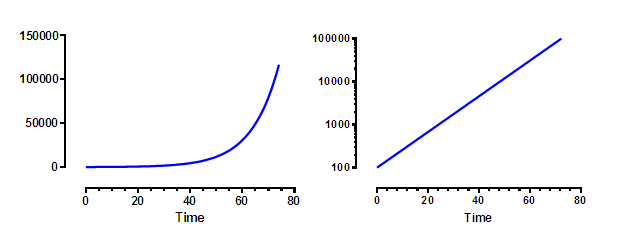
All dollar-denominated graphs in the article use linear scales, which is misleading, because price inflation is compounded (exponential). Compare the difference in how steady inflation looks between linear (left) and logarithmic (right) here:

https://www.graphpad.com/guides/prism/7/user-guide/images/em...

This is not to dismiss the fact stock market valuations are outstripping growth of the economy, but the article is definitely making it look even worse than it is.

Re: The Buffett Indicator

#33
post #10
post #8

The problem with these indicators is that, although they may indicate over- or undervaluation, they tell you nothing about when a mean reversion will happen. As Keynes famously said: "The market can stay irrational longer than you can stay solvent." An indicator that does a pretty good job of signaling the "when" of a recession, and by extension the likely "when" of large market corrections, is yield curve inversion.…

An inverted yield curve has accurately predicted 9 out of the last 5 recessions ;) You can even see it on the chart in the linked article, in 2005/06 — that time, it was different.

Fed Fund Rate vs 30YT since 1970(only cherry picking this year because the data on fred is poor before this period, and end of gold standard is significant) is a perfect 8/8[0].

[0]: https://fred.stlouisfed.org/graph/?g=ENDs

Re: The Buffett Indicator

#34
post #29
post #10

Earlier quoted context omitted.

An inverted yield curve has accurately predicted 9 out of the last 5 recessions ;) You can even see it on the chart in the linked article, in 2005/06 — that time, it was different.

That's not that bad! Still seems potentially very useful.

9/5 is terrible accuracy.

Re: The Buffett Indicator

#35
post #29
post #10

Earlier quoted context omitted.

An inverted yield curve has accurately predicted 9 out of the last 5 recessions ;) You can even see it on the chart in the linked article, in 2005/06 — that time, it was different.

That's not that bad! Still seems potentially very useful.

it's approximately 50/50. You're almost just as good with a coinflip.

Re: The Buffett Indicator

#36
post #10
post #8

The problem with these indicators is that, although they may indicate over- or undervaluation, they tell you nothing about when a mean reversion will happen. As Keynes famously said: "The market can stay irrational longer than you can stay solvent." An indicator that does a pretty good job of signaling the "when" of a recession, and by extension the likely "when" of large market corrections, is yield curve inversion.…

An inverted yield curve has accurately predicted 9 out of the last 5 recessions ;) You can even see it on the chart in the linked article, in 2005/06 — that time, it was different.

This "9 out of the last 5" quote is the deadest of beaten horses on HN. It shows up at least once a week here, and it is written with such smugness and unoriginality that it makes even dad jokes funny by comparison.

Let's cut to the chase and make a bot that posts "9 out of the last 5 recessions, hyuk!" on every post remotely related to finance and be done with it. It is the furthest thing from a substantive comment; it is a recycled low-effort joke in the style of reddit.

Re: The Buffett Indicator

#37

Now divide by M1 money supply. Is it the stock market over valued or the dollar devaluing as they print trillions of them.

I wondered about this too, but both sides of the ratio are denominated in current dollars, so dollar valuation is already divided out:

  ratio of total US stock market value to US GDP

Re: The Buffett Indicator

#38
post #24

Is Buffett indicator still relevant today with deep globalization? It does not take account of at least following factors: * Companies like BABA or SE that contribute little to US GDP. * Tech giants shift profits to low-tax countries. * Income from US only makes part of global giants' income. (I know almost nothing about economy so this is novice question, instead of a statement against the effectiveness of Buffett i…

I think this is the biggest factor - the rise of the "Buffett Indicator" implies that the stock market is increasingly valuable compared to US GDP, and thus capturing or measuring more value than just US production, but the linear expectation suggests a constant rate of globalization, with no justification.

Re: The Buffett Indicator

#39
post #10

Earlier quoted context omitted.

An inverted yield curve has accurately predicted 9 out of the last 5 recessions ;) You can even see it on the chart in the linked article, in 2005/06 — that time, it was different.

Fed Fund Rate vs 30YT since 1970(only cherry picking this year because the data on fred is poor before this period, and end of gold standard is significant) is a perfect 8/8[0]. [0]: https://fred.stlouisfed.org/graph/?g=ENDs

And how many degrees of freedom went into the choice of metrics to compare? Just because something went 8/8 doesn't mean it will predict the future crashes.
Post reply on HN