Create diagrams with code using Graphviz
1–10 of 221 posts
Re: Create diagrams with code using Graphviz
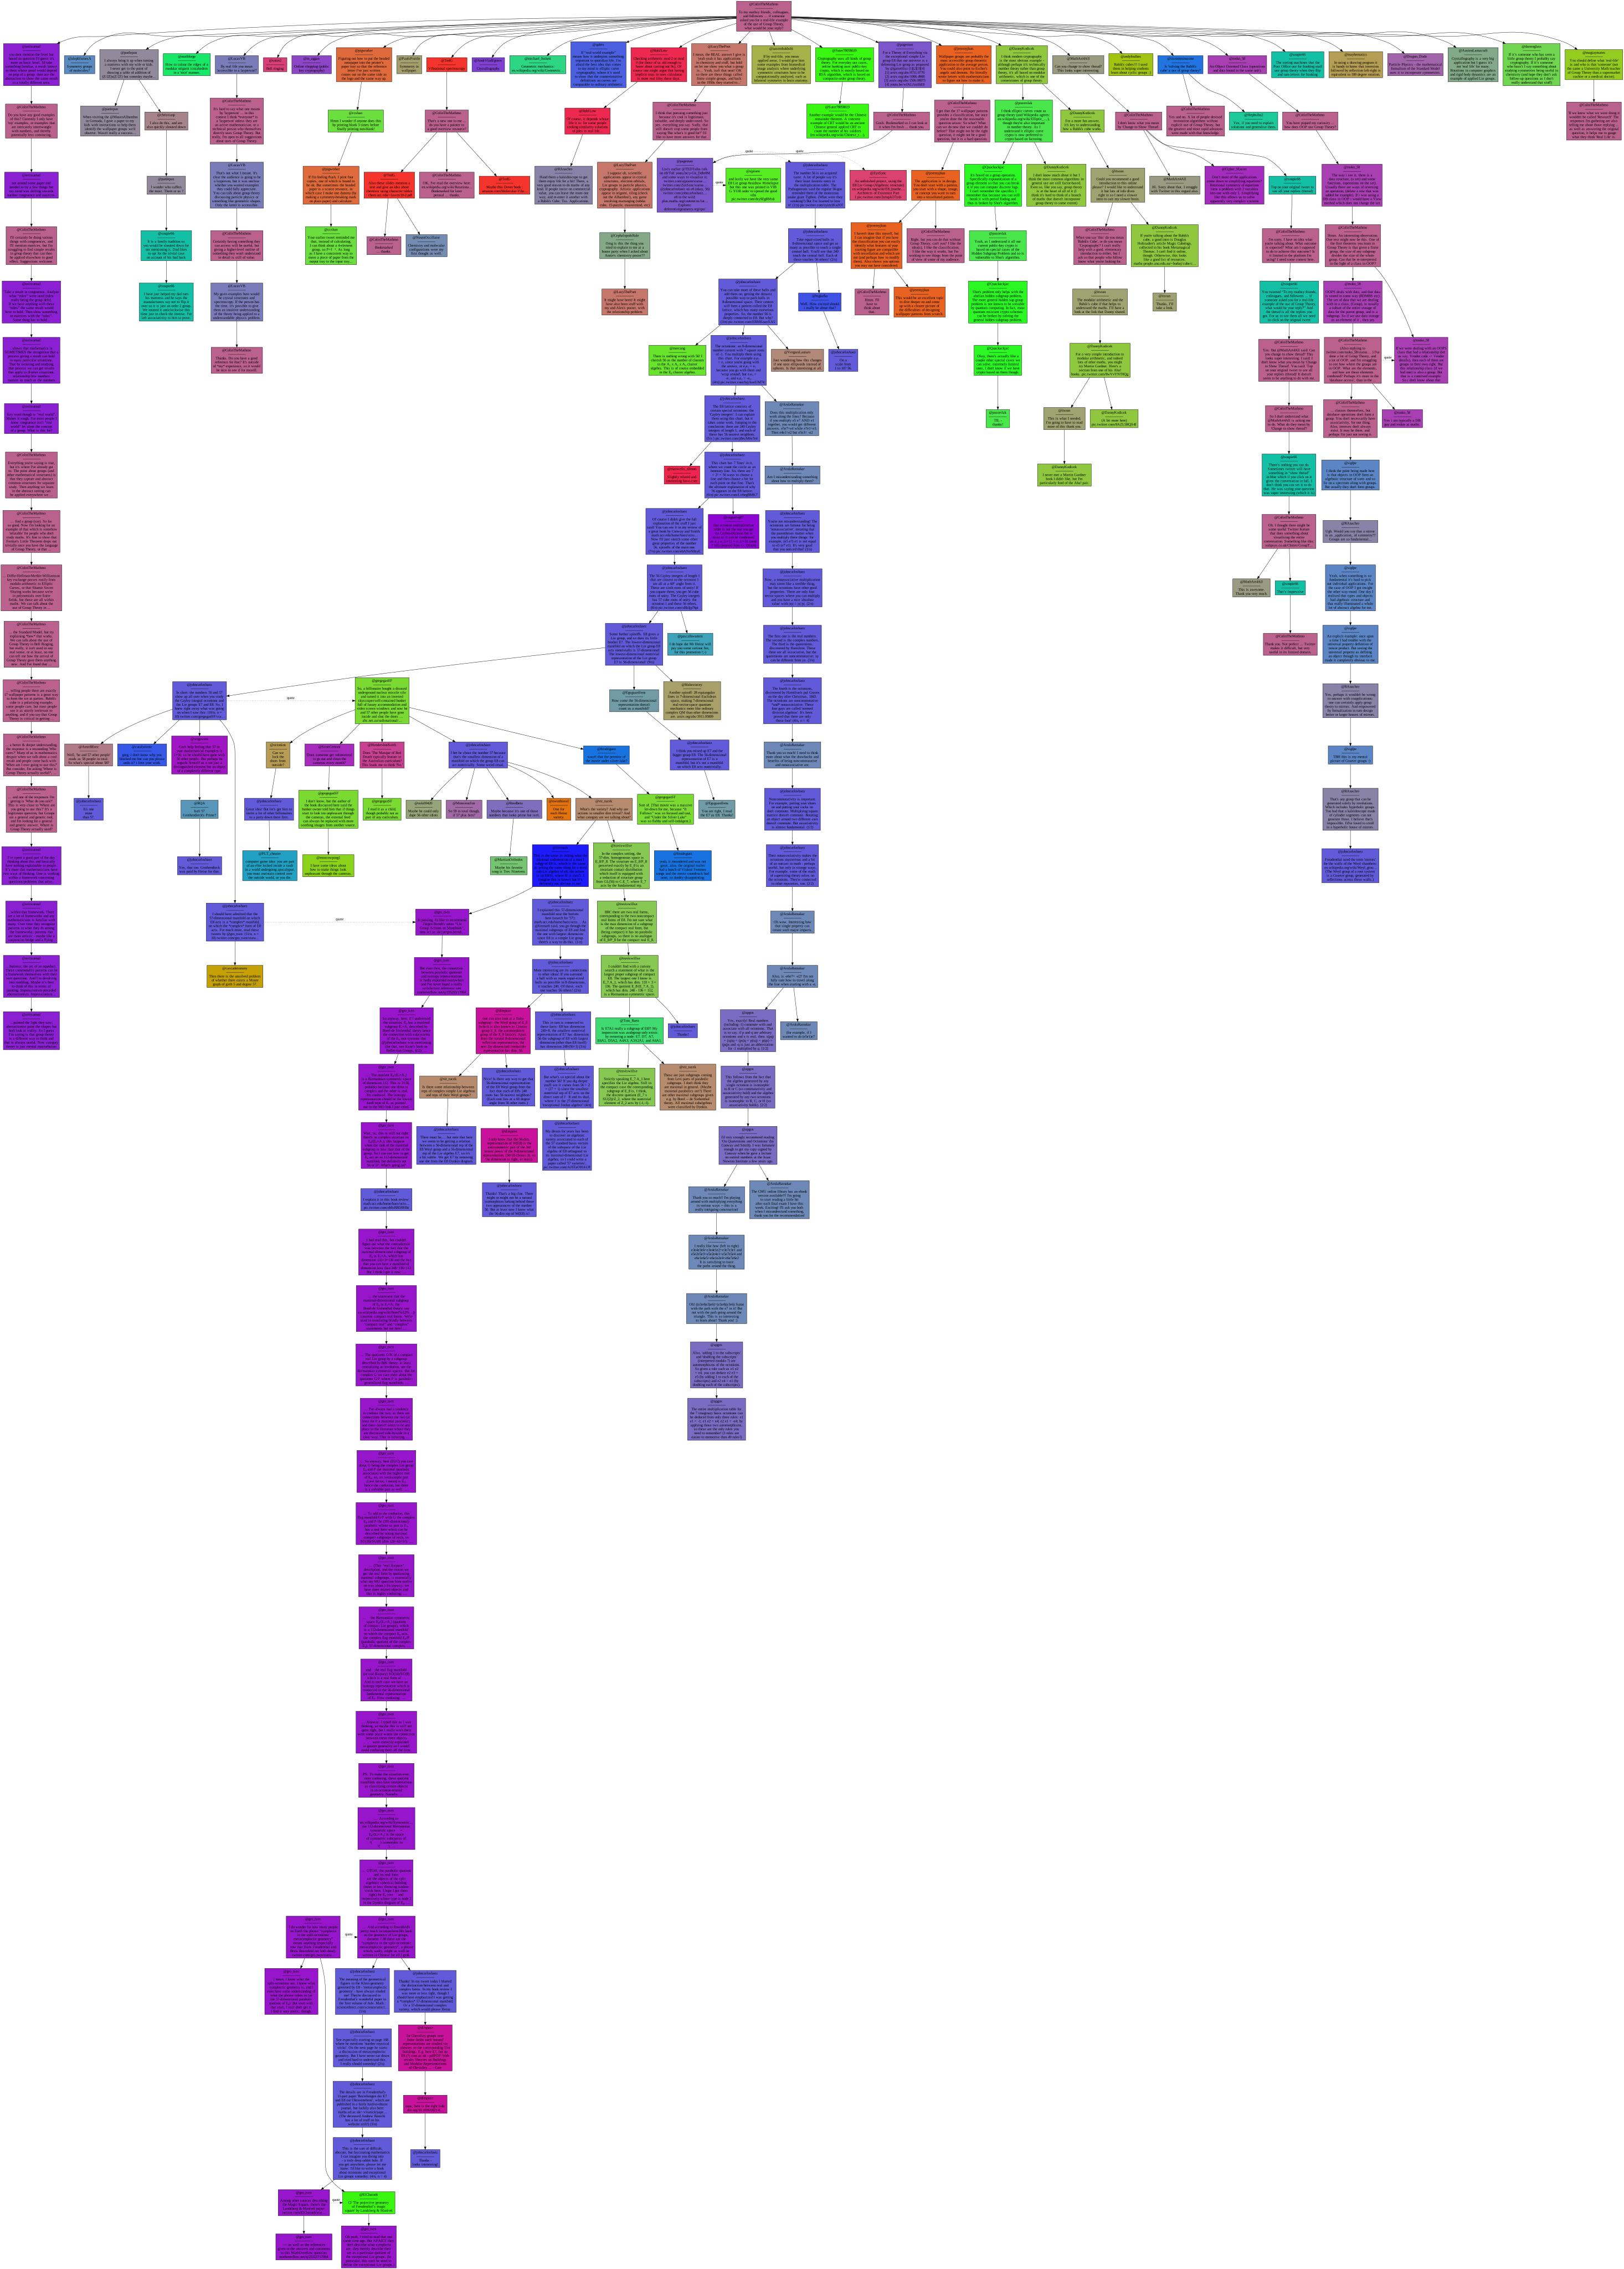
#2I use GraphViz a lot. Here it the Twitter conversation that ensued when I asked a question about the use of Group Theory "In Real Life":
Re: Create diagrams with code using Graphviz
#3I use GraphViz a lot. Here it the Twitter conversation that ensued when I asked a question about the use of Group Theory "In Real Life": https://www.solipsys.co.uk/Chitter/GroupTheory_IRL.svg
I'm using it at work, e.g. to visualize state machines. It makes it a lot easier to discuss it with business people. In Java there is a great library which translates code into graphviz markup: guru.nidi/graphviz-java
Re: Create diagrams with code using Graphviz
#4One interesting thing is that graphviz can output to many formats, including SVG. This makes it great for websites, where one can later do things like later tweak the colours on the fly.
Re: Create diagrams with code using Graphviz
#5I use GraphViz a lot. Here it the Twitter conversation that ensued when I asked a question about the use of Group Theory "In Real Life": https://www.solipsys.co.uk/Chitter/GroupTheory_IRL.svg
I'm using it at work, e.g. to visualize state machines. It makes it a lot easier to discuss it with business people. In Java there is a great library which translates code into graphviz markup: guru.nidi/graphviz-java
I don't want to diminish importance of graphviz, but PlantUML is better suited for visualizing state machines, message sequence diagrams and whatnot.
Re: Create diagrams with code using Graphviz
#6[deleted]
Re: Create diagrams with code using Graphviz
#7I like graphviz a lot, but I almost always end up using [Tikz](http://www.ctan.org/tex-archive/graphics/pgf/), which is quite a bit more flexible.
One huge advantage of Tikz is that you can use LaTeX equations natively. E.g. subscripts and superscripts in graphviz involve jumping through a few hoops, iirc.
Re: Create diagrams with code using Graphviz
#8Graphviz's syntax easy enough to programmatically generate, here's the course dependencies for CS classes at my university, for instance, generated by a Haskell program that scraped the appropriate data.

Re: Create diagrams with code using Graphviz
#9Shameless plug: I created an online Graphviz/dot editor which is powered by a language server that provides auto completion and refactorings. It uses a WASM version of Graphviz to render the graph. You can try it out here:
Re: Create diagrams with code using Graphviz
#10The Zim wiki software has a plugin for graphviz (https://www.zim-wiki.org/manual/Plugins/Diagram_Editor.html), where you can edit your graph and see the results in real time. Very helpful if only for this feature