Live data from Hacker News

Cryo-electron microscopy breaks a key barrier

nature.com

61–70 of 110 posts

Re: Cryo-electron microscopy breaks a key barrier

#61

Could someone confirm what we’re looking at in that picture please? In that spider web of blue points joined by blue line segments: Those tiny blue points are atoms? The blue line segments are covalent bonds? And what’s the difference between the blue and purple areas? If those line segments are probability distributions of shared electrons, that means our high school mental model of a covalent bond (drawing a line b…

The line segments define surfaces around the regions of highest electron density. This is how X-ray crystallographers traditionally viewed electron density, probably because that simple mesh was the best that early computer graphics systems could handle. In this particular image they've shown nested surfaces - my guess would be at 1 (purple), 2, and 3 standard deviations above the mean, or something like that. Again, not atoms, just electron clouds, but obviously the regions around the atoms have the most electrons.
Re: Cryo-electron microscopy breaks a key barrier

#62
post #39

I'm a structural biologist that uses CryoEM to study archeal viruses. I'd be happy to answer any questions about CryoEM. I did want to point out though that this title is misleading. The researchers didn't get an image of an atom. Instead, they reconstructed hundreds of thousands of images of the protein to determine where the atoms are almost exactly. So there's no actual image that shows an atom, as cool as that wo…

How long does something have to sit still to take a picture? Is there an exposure time?

Re: Cryo-electron microscopy breaks a key barrier

#63
post #58

Could someone confirm what we’re looking at in that picture please? In that spider web of blue points joined by blue line segments: Those tiny blue points are atoms? The blue line segments are covalent bonds? And what’s the difference between the blue and purple areas? If those line segments are probability distributions of shared electrons, that means our high school mental model of a covalent bond (drawing a line b…

Very good question. It'd be great to understand how this whole imaging process works. I have no idea, but it seems it involves many photos and rotation, and then DSP. So it's like CT for proteins .. maybe. It's like the x-ray crystallography but instead of repeating the x-ray many times on many-many samples. (edited) https://kpwulab.wordpress.com/2018/12/13/a-1-96-a-cryoem-map... https://cryoem.med.ubc.ca/image-galle…

Not many samples, many copies of the protein in what is often a single crystal (although if it's easily damaged, you might to use multiple crystals and combine the data post-processing). EM is actually very destructive, so they have to take thousands of micrographs of different individual molecules, and average them together.

Re: Cryo-electron microscopy breaks a key barrier

#64
post #43

Earlier quoted context omitted.

What are the limitations of this technique in determining spatial structure of the proteins? Do they get denaturated when cooled?

No, the proteins are vitrified very rapidly in liquid ethane at approx. -200°C, so that the structure ist conserved.

Protein "structure" is a slippery concept. In situ measurements, molecular dynamics simulations and basic common sense pretty conclusively show that most proteins actually have a number of conformations they access during normal biological processes. In many cases, these conformations are required for the proteins normal functions. I used to work in the de novo protein field and it was a constant source of irritation to me that what we mainly designed were crystal structures, not dynamic functional proteins.

Re: Cryo-electron microscopy breaks a key barrier

#65

Could someone confirm what we’re looking at in that picture please? In that spider web of blue points joined by blue line segments: Those tiny blue points are atoms? The blue line segments are covalent bonds? And what’s the difference between the blue and purple areas? If those line segments are probability distributions of shared electrons, that means our high school mental model of a covalent bond (drawing a line b…

The line segments define surfaces around the regions of highest electron density. This is how X-ray crystallographers traditionally viewed electron density, probably because that simple mesh was the best that early computer graphics systems could handle. In this particular image they've shown nested surfaces - my guess would be at 1 (purple), 2, and 3 standard deviations above the mean, or something like that. Again,…

So it’s not like what I thought at all. If I understand you correctly, then each one of those bright blue balls is a cloud of electrons at the center of which is a nucleus (but we don’t see the nucleus itself). The tiny blue lines and vertices are just computer generated imagery to define the “surface” of an atom. Those hexagons with six blue balls joined by purple mesh are benzene rings? So each purple area defines a cloud of shared electrons in a benzene ring?

Re: Cryo-electron microscopy breaks a key barrier

#66

Earlier quoted context omitted.

The line segments define surfaces around the regions of highest electron density. This is how X-ray crystallographers traditionally viewed electron density, probably because that simple mesh was the best that early computer graphics systems could handle. In this particular image they've shown nested surfaces - my guess would be at 1 (purple), 2, and 3 standard deviations above the mean, or something like that. Again,…

So it’s not like what I thought at all. If I understand you correctly, then each one of those bright blue balls is a cloud of electrons at the center of which is a nucleus (but we don’t see the nucleus itself). The tiny blue lines and vertices are just computer generated imagery to define the “surface” of an atom. Those hexagons with six blue balls joined by purple mesh are benzene rings? So each purple area defines…

Mostly correct, except it's only indirectly the surface of the "atom" - because of the way covalent bonding works, there's continuous electron density between atoms too. It's just that the region around the nucleus is the most electron-dense. And yes, those look like phenylalanine or tyrosine (amino acid) sidechains to me, both of which have a benzene ring at the core.

(For the record, there is also something called neutron crystallography, which works like X-ray crystallography except it's the nuclei that diffract, not the electron clouds - which allows you to visualize hydrogen atoms more directly, and even resolve the difference between hydrogen and deuterium. But it's another speciality technique, in part because neutron sources are so much weaker.)

EDIT: since I actually did some work on visualizing electron density maps on the web, here's an interactive view of an older X-ray structure (from 2003, at only 3Å resolution) that shows how a protein molecule fits into the density: http://natechols.github.io/xtal.js/map_viewer.html (click and hold the middle mouse button to pan through the molecule)

Re: Cryo-electron microscopy breaks a key barrier

#67

Earlier quoted context omitted.

The line segments define surfaces around the regions of highest electron density. This is how X-ray crystallographers traditionally viewed electron density, probably because that simple mesh was the best that early computer graphics systems could handle. In this particular image they've shown nested surfaces - my guess would be at 1 (purple), 2, and 3 standard deviations above the mean, or something like that. Again,…

So it’s not like what I thought at all. If I understand you correctly, then each one of those bright blue balls is a cloud of electrons at the center of which is a nucleus (but we don’t see the nucleus itself). The tiny blue lines and vertices are just computer generated imagery to define the “surface” of an atom. Those hexagons with six blue balls joined by purple mesh are benzene rings? So each purple area defines…

> computer generated imagery to define the “surface” of an atom

The grids are isosurfaces of electron density. Analogous to isolines on a map illustrating mountain terrain height.

Atoms are sticky little fuzzy balls. The fuzz, electron density, falls off exponentially. They don't have an "edge" in a non-fuzzy-object sense. Analogous to a stereotype volcano having an arbitrary perimeter. Where would I place it? Where you need climbing gear? Where biking up gets hard? In the foothills? Somewhere on the sloped plain? You place the perimeter wherever is convenient for what you're trying to use it for. People are usually interested in the densities between sticking atoms, which are several orders of magnitude down from peak density. Analogous to drawing an isoline at "the towering volcano is here high enough to start stubbing your toe on it". The picture draws isosurfaces of electron density at something like "around here one atom would 'bump' another, and you can see bonds" and at "I wrap a single atom only, but still have an interesting shape".

To show the various features of interest, one draws multiple isosurfaces. As with a terrain map. But an exponential electron density scale is harder to represent than linear height scale. And it's hard to clearly draw more than a couple of nested 3D isosurfaces. So instead of placing many iso's at linear steps, here there are just a couple, more like an order of magnitude apart.

Re: Cryo-electron microscopy breaks a key barrier

#68

Earlier quoted context omitted.

So it’s not like what I thought at all. If I understand you correctly, then each one of those bright blue balls is a cloud of electrons at the center of which is a nucleus (but we don’t see the nucleus itself). The tiny blue lines and vertices are just computer generated imagery to define the “surface” of an atom. Those hexagons with six blue balls joined by purple mesh are benzene rings? So each purple area defines…

> computer generated imagery to define the “surface” of an atom The grids are isosurfaces of electron density. Analogous to isolines on a map illustrating mountain terrain height. Atoms are sticky little fuzzy balls. The fuzz, electron density, falls off exponentially. They don't have an "edge" in a non-fuzzy-object sense. Analogous to a stereotype volcano having an arbitrary perimeter. Where would I place it? Where…

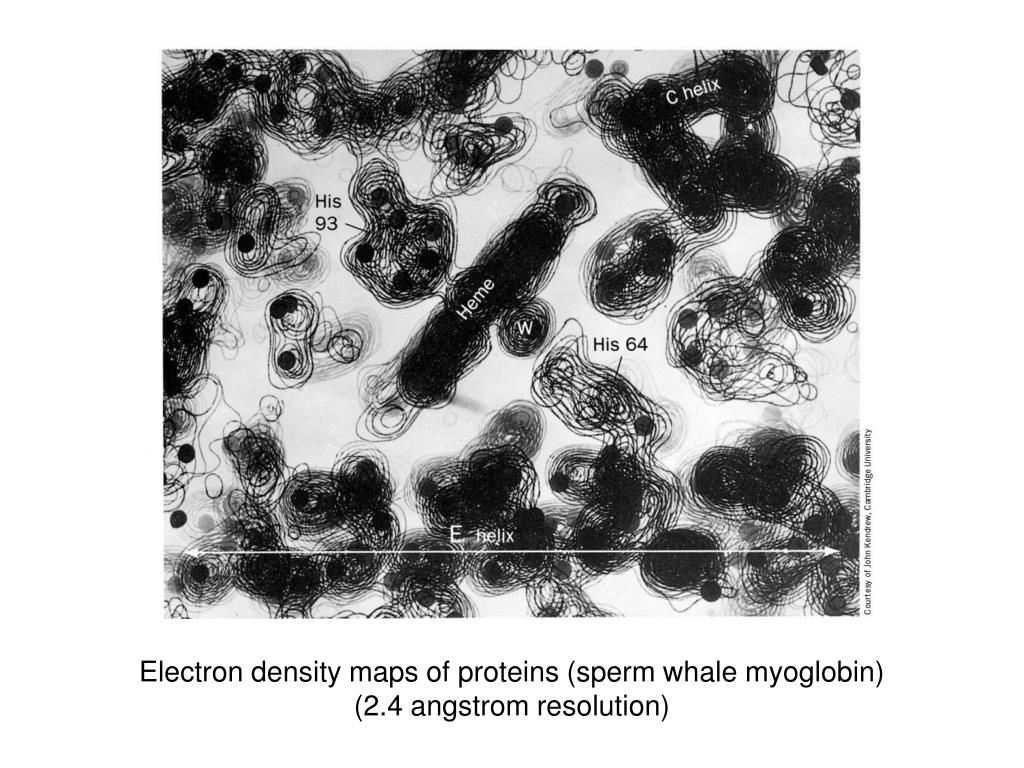
The terrain analogy is great - this is how the first structural biologists had to view electron density: https://image.slideserve.com/105608/electron-density-maps-of... I think this is a stack of 2d "slices" through the density, printed on transparencies. But I've also seen 2d representations of charge density (some of which is just theoretical studies) that are even more similar to a terrain map.

Re: Cryo-electron microscopy breaks a key barrier

#69
post #39

I'm a structural biologist that uses CryoEM to study archeal viruses. I'd be happy to answer any questions about CryoEM. I did want to point out though that this title is misleading. The researchers didn't get an image of an atom. Instead, they reconstructed hundreds of thousands of images of the protein to determine where the atoms are almost exactly. So there's no actual image that shows an atom, as cool as that wo…

what is the typical career/study path for this field ?

Re: Cryo-electron microscopy breaks a key barrier

#70

Earlier quoted context omitted.

> computer generated imagery to define the “surface” of an atom The grids are isosurfaces of electron density. Analogous to isolines on a map illustrating mountain terrain height. Atoms are sticky little fuzzy balls. The fuzz, electron density, falls off exponentially. They don't have an "edge" in a non-fuzzy-object sense. Analogous to a stereotype volcano having an arbitrary perimeter. Where would I place it? Where…

The terrain analogy is great - this is how the first structural biologists had to view electron density: https://image.slideserve.com/105608/electron-density-maps-of... I think this is a stack of 2d "slices" through the density, printed on transparencies. But I've also seen 2d representations of charge density (some of which is just theoretical studies) that are even more similar to a terrain map.

Neat. I've been exploring visual representations of electron density, optimized for educational use with XR. Intending to illustrate that science education content could be made transformatively less wretched.

Isosurfaces and nonlinear color gradients are educationally problematic. And fuzz gradients are hard to visually stereo fuse. And on near-term AR displays, black is transparent, and background environment colors can't be manipulated, which limits the space of attainable colorizations.

My current thought is to approach it as a volumetric light source. Composed of several linear scales, each a different color, with density as transparency. And respecting their true density when combined, so higher density scales "shine through" lower. We'll see. Maybe overlay random sample "sparkles" to maybe improve sense of spatial extent.

I've not seen much similar work. If you know of any, I'd love to hear of it. Also, it seems there was a push some years back to emphasize electron density when teaching intro chemistry. A push that doesn't seem to have gelled. I've guesses, but I'd value thoughts on why.

Post reply on HN