Live data from Hacker News

WTF Happened in 1971?

wtfhappenedin1971.com

41–46 of 46 posts

Re: WTF Happened in 1971?

#41
post #35

Earlier quoted context omitted.

What triggered this investigation? I agree that it does look like a phase-change. But did you throw out any graphs that didn't have a phase-change appearance? I'm genuinely curious. Seems like there are different arguments below-the-surface in this thread.

For me, what triggered it was noticing several startling graphs that all seemed to show a) something sudden, b) at the same time. I started collecting such graphs. It appears the author of this website has done the same. Note that all the "commentary" is embedded in the images - there's no indication that the webmaster has any agenda beyond mine (although the various graph publishers might). I don't really understand…

> I don't really understand your question about throwing out graphs that don't show a phase-change. There are infinite unrelated graphs.

Unrelated in what sense? Your example seems a bit of a straw man. What other graphs of economic activity and change do not show a significant and sudden shift at ~1971 (is what I think the parent is asking)?
Re: WTF Happened in 1971?

#42
What about computerization of white collar work as a factor? Minicomputers, such as DEC, started spreading into medium-sized businesses and departments. The wealthy got the benefits of such but it didn't trickle down to those laid off or who had to go back to school after their job was automated away. Offshoring of manufacturing to Asia also began increasing around that time. Thus, it could be a combination of offshoring and automation.

Re: WTF Happened in 1971?

#43
post #39
post #27

Earlier quoted context omitted.

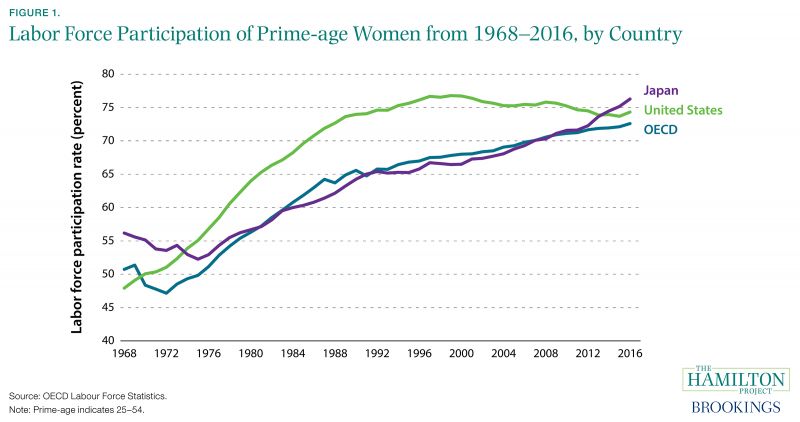
The one graph missing from this is the workplace participation rate for women which increased rapidly from an average of 47% to 65% between 1972 and 1984 for OECD countries. A large number of households would have gone from having a single breadwinner to two as more women entered the workforce. The expansion of the pool for workers would have had a supply-side impact on wages. Initially many households would have see…

There doesn't seem to be any inflection point in that graph, so I'm not sure why you consider it relevant: https://en.wikipedia.org/wiki/Labor_force_in_the_United_Stat...

Not for the US which started earlier after the Equal Pay for Equal Work Act was signed.

The graph for OECD countries on average which includes the US turns in the early 70s. From a report on Japanese women participation going the opposite direction.

https://www.hamiltonproject.org/ee-ce-image/made/assets/img/...

Re: WTF Happened in 1971?

#44
post #35

Earlier quoted context omitted.

For me, what triggered it was noticing several startling graphs that all seemed to show a) something sudden, b) at the same time. I started collecting such graphs. It appears the author of this website has done the same. Note that all the "commentary" is embedded in the images - there's no indication that the webmaster has any agenda beyond mine (although the various graph publishers might). I don't really understand…

> I don't really understand your question about throwing out graphs that don't show a phase-change. There are infinite unrelated graphs. Unrelated in what sense? Your example seems a bit of a straw man. What other graphs of economic activity and change do not show a significant and sudden shift at ~1971 (is what I think the parent is asking)?

Yes, this is what I meant.

To be clear, I'm not accusing anyone of intentionally being misleading. But consider this process:

1) Notice an inflection

2) Search through a near-infinite number of economic indicators

3) Select those other indicators bearing an inflection-point

This is very non-Baysian.

Re: WTF Happened in 1971?

#45
post #35

Earlier quoted context omitted.

What triggered this investigation? I agree that it does look like a phase-change. But did you throw out any graphs that didn't have a phase-change appearance? I'm genuinely curious. Seems like there are different arguments below-the-surface in this thread.

For me, what triggered it was noticing several startling graphs that all seemed to show a) something sudden, b) at the same time. I started collecting such graphs. It appears the author of this website has done the same. Note that all the "commentary" is embedded in the images - there's no indication that the webmaster has any agenda beyond mine (although the various graph publishers might). I don't really understand…

Well it sounds strange the way you say it, but video evidence of someone not committing a crime is often a pretty good alibi, right?

Re: WTF Happened in 1971?

#46
Milton Friedman introduced the Shareholder Theory in 1970, where he argued that a company has no responsibility to society and that its only responsibility is to the shareholders. As good a source as any...
Post reply on HN