Inspired from it you also have pev if you prefer something more visual : http://tatiyants.com/postgres-query-plan-visualization/
PostgreSQL's Explain Analyze Made Readable
21–30 of 62 posts
Re: PostgreSQL's Explain Analyze Made Readable
#22I've enjoyed using pev[1]. It's based on this tool but lays out the plan graphically. [1] http://tatiyants.com/pev/#/plans/plan_1550754076978
FYI, the tool saves the plans on your local storage, so links won't work :)
Re: PostgreSQL's Explain Analyze Made Readable
#23I would pay good money for an extension that could answer how the query planner makes decisions about a given query.
Re: PostgreSQL's Explain Analyze Made Readable
#24I am a bit frustrated with one question regarding explain cost. Namely how to map the cost to wall time. Based on my research so far, andwer is about "you can't". But that is difficult for me to understand. I mean, I do understand that it does not map with high (or even relatively low) accuracy. But the cases where I have been needing the information are more like me wondering after 15 minutes of runtime whether the…
That is pretty much it. For other database engines' query planners too.
Everything that goes into the cost estimate is at best an educated guess, so the result is never going to map neatly to wall-clock time or any other measure.
Remember: the query planner's job is not to find the best plan possible for a given statement. This would be an impossible task. The planner's job is to try find a plan that is good enough and do so fast as possible.
To cut a short post long:
The cost is an educated guess, based on index statistics where available. Assuming it is similar to the cost calculations SQL Server uses is a mix of expected CPU use, I/O bandwidth use, memory required for the operation to touch disk as little possible, how large a load of locks the process might need to take (depending on the current isolation level settings), and so forth. Because you might have faster/slower CPU cores, more/less of them, faster/slower RAM, more/less cache per core, a lower/higher latency network, a set of drives that are faster/slower for random/bulk IO, etc., than the reference systems this mix was based upon, the cost is not going to exactly map to anything on your machine even if it does on some reference machine(s) somewhere in the development/testing chain.
Those reference machines might not even really exist. In SQL Server's case they are probably machines that sat under some developer's desks in the late 90s, so the balance might be significantly off for most modern use cases. This is part of why MS are playing around with cardinality estimators and other related bits in recent versions: the guesses they used to make don't make as much sense on modern systems, so they are having to be updated to make them more relevant. In some cases the estimates (those applied to table variables for instance) are still a stab in the dark, but they are now a stab that is more likely to be close to correct on modern kit than the stabs it used to take.
This is why index hints are needed. Because of the many variables involved, all the query planner can hope to do to assess each plan against the other possibilities, without a more exhaustive analysis which for many queries might take longer than running the query on the worst plan ever would, is a best guess. If you asking it to do something complex, sometimes you have to guide it towards the better plan.
Re: PostgreSQL's Explain Analyze Made Readable
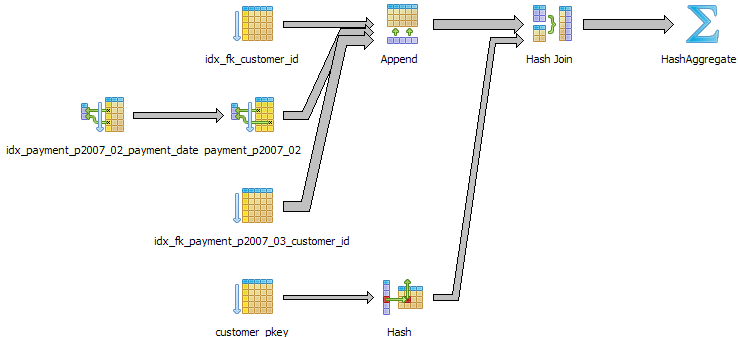
#25pgAdmin has a really good EXPLAIN visualisation tool built-in which makes it into a neat little diagram
pgAdmin by itself is a _really_ horrible program to use otherwise though. I do wish that it was as polished as the database core itself seems to be.
Re: PostgreSQL's Explain Analyze Made Readable
#26Earlier quoted context omitted.
pgAdmin by itself is a _really_ horrible program to use otherwise though. I do wish that it was as polished as the database core itself seems to be.
Yep... the one very good thing that I got out of pgAdmin was that it finally convinced me to get psql under my fingers so I wouldn't have to use pgAdmin.
Re: PostgreSQL's Explain Analyze Made Readable
#27There is also this excellent post which shows how to break down an EXPLAIN and reason about the performance [1].
[0] http://www.postgresonline.com/images/journal/explain_plan_5....
[1] http://www.postgresonline.com/journal/archives/27-Reading-Pg...
Re: PostgreSQL's Explain Analyze Made Readable
#28By the way, if you think this is cool, Hubert (creator of depesz) is a DBA at Instructure, making software for schools (Canvas) and employee training (Bridge). We open-source a ton of stuff (code.instructure.com).
We're hiring leads + senior engineers in Chicago, Salt Lake City, Seattle, and Budapest! If you're interested, feel free to reach out to neil+hn@instructure.com or check out what's available at https://jobs.lever.co/instructure?lever-via=NiHimSaI8r&team=...
Re: PostgreSQL's Explain Analyze Made Readable
#29I am a bit frustrated with one question regarding explain cost. Namely how to map the cost to wall time. Based on my research so far, andwer is about "you can't". But that is difficult for me to understand. I mean, I do understand that it does not map with high (or even relatively low) accuracy. But the cases where I have been needing the information are more like me wondering after 15 minutes of runtime whether the…
Re: PostgreSQL's Explain Analyze Made Readable
#30Someone made a flame graph analyzer for Oracle queries, which seems like an even better way of visualizing explains, and seems like it would be fairly straightforward to translate to postgres: https://externaltable.blogspot.com/2014/05/flame-graphs-for-...