Live data from Hacker News

Fun with NFL Stats, Bokeh, and Pandas

j253.github.io

21–28 of 28 posts

Re: Fun with NFL Stats, Bokeh, and Pandas

#22

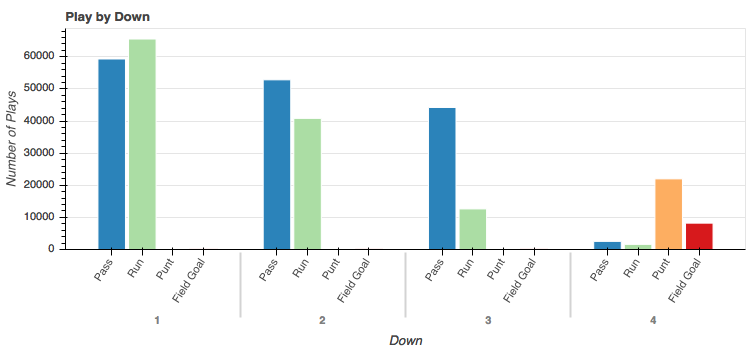
> Passing becomes more and more popular as you use up your downs. Just in case author sees this, this is wrong, right? It should read Running becomes more and more popular as you use up your downs? (Regarding https://j253.github.io/blog/images/article_01/01_play_by_dow... )

> Just in case author sees this, this is wrong, right? It should read Running becomes more and more popular as you use up your downs?

Er, no, the author is right; the share of all plays that are passing plays goes up with down number (until dropping at 4), the graph shows that quite clearly.

Re: Fun with NFL Stats, Bokeh, and Pandas

#23
post #15

Does anyone have any insight about what kind of jobs are out there for people with the kind of skills demonstrated in this post? I have a lot of data exploring, cleaning and visualizing skills, python/SQL skills and experience using it to make business decisions, but this type of thing falls short of what most people would consider "data science"

Agreed. And I definitely make no claims about this being earth-shattering "data science". I just happened spend a few hours over the weekend making some plots and commenting about what I saw with some Python tools. I'll also state that I am neither a data scientist nor a statistician. I'm a Python application engineer with a background in mechanical engineering, so that might help set the context a bit more.

Most companies don't need "earth-shattering 'data science'", they need a way convey a narrative with their information and maybe try to deduce something from it.

I work as a programmer at an architecture company and we do visualizations like this all the time for campus classroom usage for example. Is it groundbreaking? Of course not, but it helps the clients and designers a ton.

Re: Fun with NFL Stats, Bokeh, and Pandas

#24
post #10

> The small spikes at 5 yard increments is interesting and I don't really have a good explanation other than to think that whoever recorded the yardage data liked rounding to the nearest 5 if it was close. Anyone else have any other ideas? I'll go with the idea that the refs are biased with their ball placement and tend to put the ball on lines [0]. Also, players/teams practice, speak, think in 5 yard increments, so…

There are multiple other factors involved that aren't discussed fully in that article.

To start the ref bias is not necessarily unintentional. Measuring first downs and exact placement of the line of scrimmage becomes more difficult and takes more time when the ball is not initially spotted on an 5 yard increment or individual hash mark. The league offices might directly instruct refs to spot the ball on an exact yard line if there is any doubt of the spot in order to speed up the game. An obvious example of this intentional bias is when the ball is punted out of bounds. It is nearly impossible for a ref to get an exact spot in that situation and yet it is almost always spotted exactly on a hash mark.

Also lots of drives will start on a set yard line and penalties are often handed out in 5 yard increments. So while there are no rules that will start a drive on the 15, there are rules that will start a drive on the 20 or 25 and a standard 5 or 10 yard penalty would place the ball exactly at the 15 yard line.

Lastly, the spot is a continuous data point that is being recorded by humans as a discrete data point. That means the herding could be exaggerated in the recorded data and not necessarily as pronounced during the actual game. A ball might be spotted by the ref at 14.4 yards but the person responsible for data entry might eye the spot and record it as being at the 15 yard line.

Re: Fun with NFL Stats, Bokeh, and Pandas

#25
post #10

> The small spikes at 5 yard increments is interesting and I don't really have a good explanation other than to think that whoever recorded the yardage data liked rounding to the nearest 5 if it was close. Anyone else have any other ideas? I'll go with the idea that the refs are biased with their ball placement and tend to put the ball on lines [0]. Also, players/teams practice, speak, think in 5 yard increments, so…

It also could be bias in the person recording the data, who may unconsciously prefer rounding placements between the 4 and 6 yard lines to 5.

Re: Fun with NFL Stats, Bokeh, and Pandas

#26
post #3

Very cool! I would love to see heatmaps of play type with downs on one axis and yards-to-first-down on the other.

Something like this? http://www.yardsgained.com/#(passes_~_sacks)_~_first_down_at...

Oh wow, that site is excellent. I think this is the query I was thinking of before, the percentage of passes conditional on down and distance:

http://www.yardsgained.com/#(passes_~_sacks)_~_(passes_~_sac...

Re: Fun with NFL Stats, Bokeh, and Pandas

#27
post #10

> The small spikes at 5 yard increments is interesting and I don't really have a good explanation other than to think that whoever recorded the yardage data liked rounding to the nearest 5 if it was close. Anyone else have any other ideas? I'll go with the idea that the refs are biased with their ball placement and tend to put the ball on lines [0]. Also, players/teams practice, speak, think in 5 yard increments, so…

While I have no explanation for the clustering, a yard is a long, long measure in football, with a dozen 4K cameras and a lot of very vested interests. Occasionally spots seem generous or not, but that's to the measure of a couple of inches (e.g. he went down 4" short of the first down). As a long time fan it just doesn't seem reasonable to me that the ref opts for the 40 yard line instead of the 39 because there's a line. That's a 3 foot difference. To further support this, the bordering two yard counts do not depress the amount of the excess on the 5 yard marker.

Not to mention that where the refs place the ball -- near the center of the field, usually on the left or right side depending upon where the play ended -- has a line on every yard marker.

But again I have no explanation. We know that touchbacks start on the 20 or 25 yard line, and penalties are increments of 5 yards (e.g. face mask would be 15 yards, holding 10 yards, false start 5 yards, encroachment 5 yards, etc...and these can pile, kickoff out of the last five yards starts at the 40 yard line, etc), and to some degree this explains the 5 yard excess.
Re: Fun with NFL Stats, Bokeh, and Pandas

#28
post #10

> The small spikes at 5 yard increments is interesting and I don't really have a good explanation other than to think that whoever recorded the yardage data liked rounding to the nearest 5 if it was close. Anyone else have any other ideas? I'll go with the idea that the refs are biased with their ball placement and tend to put the ball on lines [0]. Also, players/teams practice, speak, think in 5 yard increments, so…

I've often wondered if there was a way to detect bias in officiating. Naturally there's going to be subjective element to the types of penalties called, but I also have wondered if there was a way to detect bias in the situations in which penalties are called and how they affect the probability of victory.

Additionally, with the whole Tim Donaghy [0] NBA thing, I have always been curious if there was a way to detect referee influence on the outcomes of games based on the line. There certainly times when Vegas loses (a few weeks ago was particularly bad for them), but it would be interesting to see if there was a way to detect probabilities of officials, coaches, or even players deciding the outcome of matches beyond the course of the endeavor.

But really, it'd be fun to have statistical backing to confirm or refute the whole "College Football has a pro-East Coast bias" or "this referee always gives fouls to the European soccer sides", or "the Patriots _always_ get those calls because ... Tom Brady."

[0] https://en.wikipedia.org/wiki/2007_NBA_betting_scandal

Post reply on HN