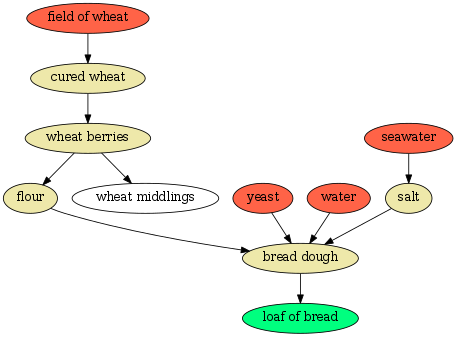
Glad to see somebody else trying something like this. I was manually maintaining some charts like this for a while at a prior job and was toying with productizing it, it's super powerful, especially if you've got a large backlog or a large feature list ahead of you. I wanted to have another representation that generated the GraphViz files, though, so you could more easily do other work with the data. Some other featu…
We should talk. I was thinking size of node could == some kind of measure of size/risk/significance. There's lots of things one might want to visualise, so some collaborated standard would be good.
Don't forget other modalities. E.g.
  Size: effort estimate
  Number of edges to the shape: depth of dependencies.
  Brightness: size of dependencies.
  Hue: ...tbd...
  Border (double/triple/dashed): ...tbd...
  Font size: ...tbd...