Time Travel Debugging
docs.microsoft.com
Time Travel Debugging
1–10 of 52 posts
Re: Time Travel Debugging
#2This is cool stuff to see in the world of C++. It's great to see language communities feed off each other and drive innovation like this.
Re: Time Travel Debugging
#3This is cool stuff to see in the world of C++. It's great to see language communities feed off each other and drive innovation like this.
I think it has been in gdb before Swift.
Re: Time Travel Debugging
#4TTD is efficient and works to add as little as possible overhead as it captures code execution in trace files.
...and then in the table below the screenshot...
Large overhead at record time. May collect more data that is needed. Data files can become large.
Based on past experiences with debugging using tracepoints etc., I'm more inclined to believe the latter.
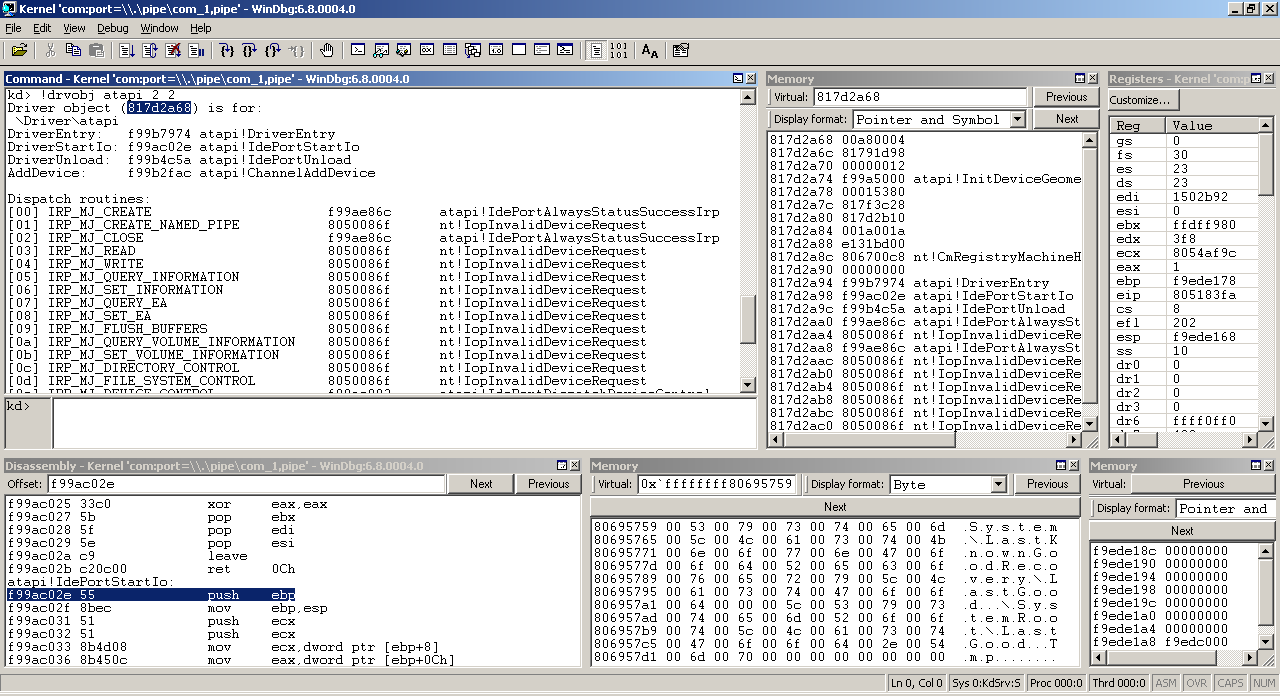
Also, as a side-note, the "more modern visuals" of "WinDbg Preview" look horrible. It's a debugger, not a toy for the barely-computer-literate. Those who want the "friendly experience" will use Visual Studio instead, which amusingly enough continues to have menus instead of the disgusting ribbons as of the latest 2017 version. The screenshot also shows two lines of slightly-misaligned "Command" "Memory" "Source". Yuck.
(For those who don't understand, this what the original WinDbg looks like --- simple and functional: http://sandsprite.com/blogs/images/main_ui.png )
Re: Time Travel Debugging
#5This is cool stuff to see in the world of C++. It's great to see language communities feed off each other and drive innovation like this.
I think it has been in gdb before Swift.
Yes: https://www.gnu.org/s/gdb/news/reversible.html
This has approximately nothing to do with C++ or even "language communities".
Re: Time Travel Debugging
#6Earlier quoted context omitted.
I think it has been in gdb before Swift.
Yes: https://www.gnu.org/s/gdb/news/reversible.html This has approximately nothing to do with C++ or even "language communities".
Strange, the impression I got from MS devs on Twitter is that this is something they have been working on for a while that they just finished and premiered at a CPP conference.
Re: Time Travel Debugging
#7Very cool stuff! Microsoft also developed a TTD system for JavaScript/Node.js: https://www.microsoft.com/en-us/research/publication/time-tr...
At LogRocket (https://logrocket.com) we're building a TTD of sorts for recording production users in your web app. While we can't replay exact code, we can get you most of the way there with DOM recording/logs/network waterfall.
Re: Time Travel Debugging
#8Here's a review from the Mozilla folks: http://robert.ocallahan.org/2017/10/thoughts-on-microsofts-t...
Re: Time Travel Debugging
#9Earlier quoted context omitted.
Yes: https://www.gnu.org/s/gdb/news/reversible.html This has approximately nothing to do with C++ or even "language communities".
Strange, the impression I got from MS devs on Twitter is that this is something they have been working on for a while that they just finished and premiered at a CPP conference.
The core technology was born out of a group in MS research long ago. Moving from research code to production is highly non-trivial. I first heard how time travel debugging was implemented before i knew about Facebook. I suspect SSDs are part of what made this more practical as it used to simply saturate disk IO, even on specialized systems. With a pci express SSD this becomes much more pragmatic then when the initial idea was implemented.
If the overhead doesn’t prevent capturing a trace reproducing the symptom, there is zero reason you cannot find the root cause. But that actually pales in comparison with treating the execution traces as data.
Re: Time Travel Debugging
#10TTD is efficient and works to add as little as possible overhead as it captures code execution in trace files. ...and then in the table below the screenshot... Large overhead at record time. May collect more data that is needed. Data files can become large. Based on past experiences with debugging using tracepoints etc., I'm more inclined to believe the latter. Also, as a side-note, the "more modern visuals" of "WinD…
[deleted]