Full Disclosure, I am the Chief Data Scientist of Domino Data Lab (
https://www.dominodatalab.com), a company that builds tools for collaboration/scaling of data science a quantitative research teams. I spoke about our view on data provenance at UseR! 2016 and if you're curious you can watch the video here
https://blog.dominodatalab.com/providing-digital-provenance-.... The rest of this comment is not about reproducibility and provenance however, it's mostly about collaboration.
I really like this write-up. It's really quite prescient for a blog post from 2013! There have been amazing advances in the tooling for individual data scientists. RStudio, Jupyter, and Zeppelin notebooks have provided a really fluid REPL for data science. This has really compressed the workflows he discusses, and provides feedback and direction to data scientists much more quickly than the program oriented process. It’s interesting to note how an unexpected direction (notebooks) can impact praxis.
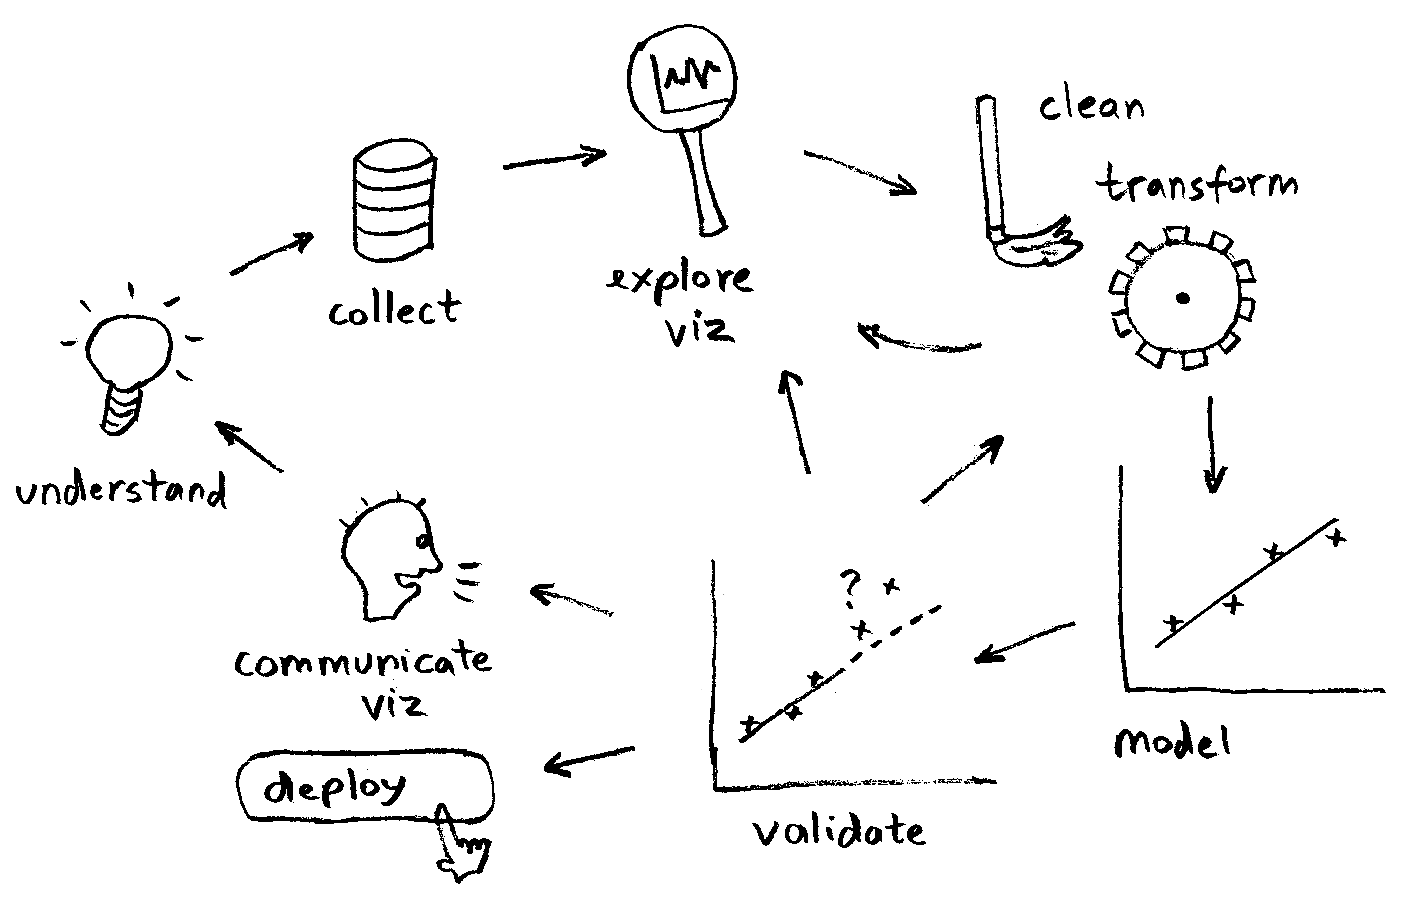
I refer to these two visualizations of the data science process often. The first is by Szilard Pafka, and it details the workflow he has experienced by having models in production for well over a decade at this point. It’s available here:
https://raw.githubusercontent.com/szilard/datascience-1slide...
What I really like about this is that it really shows the centrality of model validation. From model validation, you can often find yourself having to go back to exploration, cleaning/transformation, etc. Guo’s diagram calls this preparation, which only has an out-arrow. Preparation is not something that is one-and-done, you return to it often in the DS lifecycle.
I also really like this particular visualization, it’s from UC Berkley and it’s the “understanding science” model of the scientific process.
http://undsci.berkeley.edu/flowchart_noninteractive.php
Much like Guo’s or Szilard’s diagram, the centrality of testing/validation/analysis is telling. The nature of collaboration is more explicit in this model. In the post, Guo states:
Lastly, data scientists often collaborate with colleagues by sending them partial results to receive feedback and fresh ideas. A variety of logistical and communication challenges arise in collaborations centered on code and data sharing." I think this is particularly insightful. The challenges of scaling a data science team are different often than those of scaling a software team (for example), and I think he foresaw that before a lot of folks did.
I agree with this, but with two additional points. Often colleagues are from very different disciplines. Business stakeholders or subject matter experts that don’t understand the analysis, but they understand some feature/outcome with depth. In the Berkeley understanding science diagram, I really like that it’s explicitly called out as “community analysis and feedback.” I think that’s an important distinction that it’s not just other data scientists that provide feedback, the artifacts of the DS process have to be accessible to a wide assortment of backgrounds and skills.
It’s also interesting that from community analysis and feedback you can find yourself in any of the stages, exploration/discovery, testing, and benefits and outcomes. This is why organizations find themselves challenged to measure the progress of their DS teams, and why forecasting the amount of effort that will be required can be daunting without wide error bars. Data science is unique in that the data can be correct, the pipeline can be reproducible, the model perform perfectly in cross validation, but when it’s put into production it can be completely wrong. Prediction about prediction is hard.
I do like how all of these models, the Szilard model, the Understanding Science model, and Guo’s model share a lot in common. The loopbacks, the different phases, and the centrality of analysis/testing/validation are shared among all of them. My intuition is that getting that part of the process right, in a fluid way that scales beyond one researcher, is often the biggest roadblock to scaling quantitative research.