How to Use t-SNE Effectively
distill.pub
How to Use t-SNE Effectively
1–10 of 16 posts
Re: How to Use t-SNE Effectively
#2Has anyone here used t-SNE for visualization of their high dimensional data for machine learning? Were you able to ensure that your feature space was good via t-SNE?
Re: How to Use t-SNE Effectively
#3Has anyone here used t-SNE for visualization of their high dimensional data for machine learning? Were you able to ensure that your feature space was good via t-SNE?
t-SNE is used very widely in ML, both to analyze input data and to analyze learned representations.
To me, the canonical example of people using t-SNE this way is visualizing word embeddings, like this: http://metaoptimize.s3.amazonaws.com/cw-embeddings-ACL2010/e...
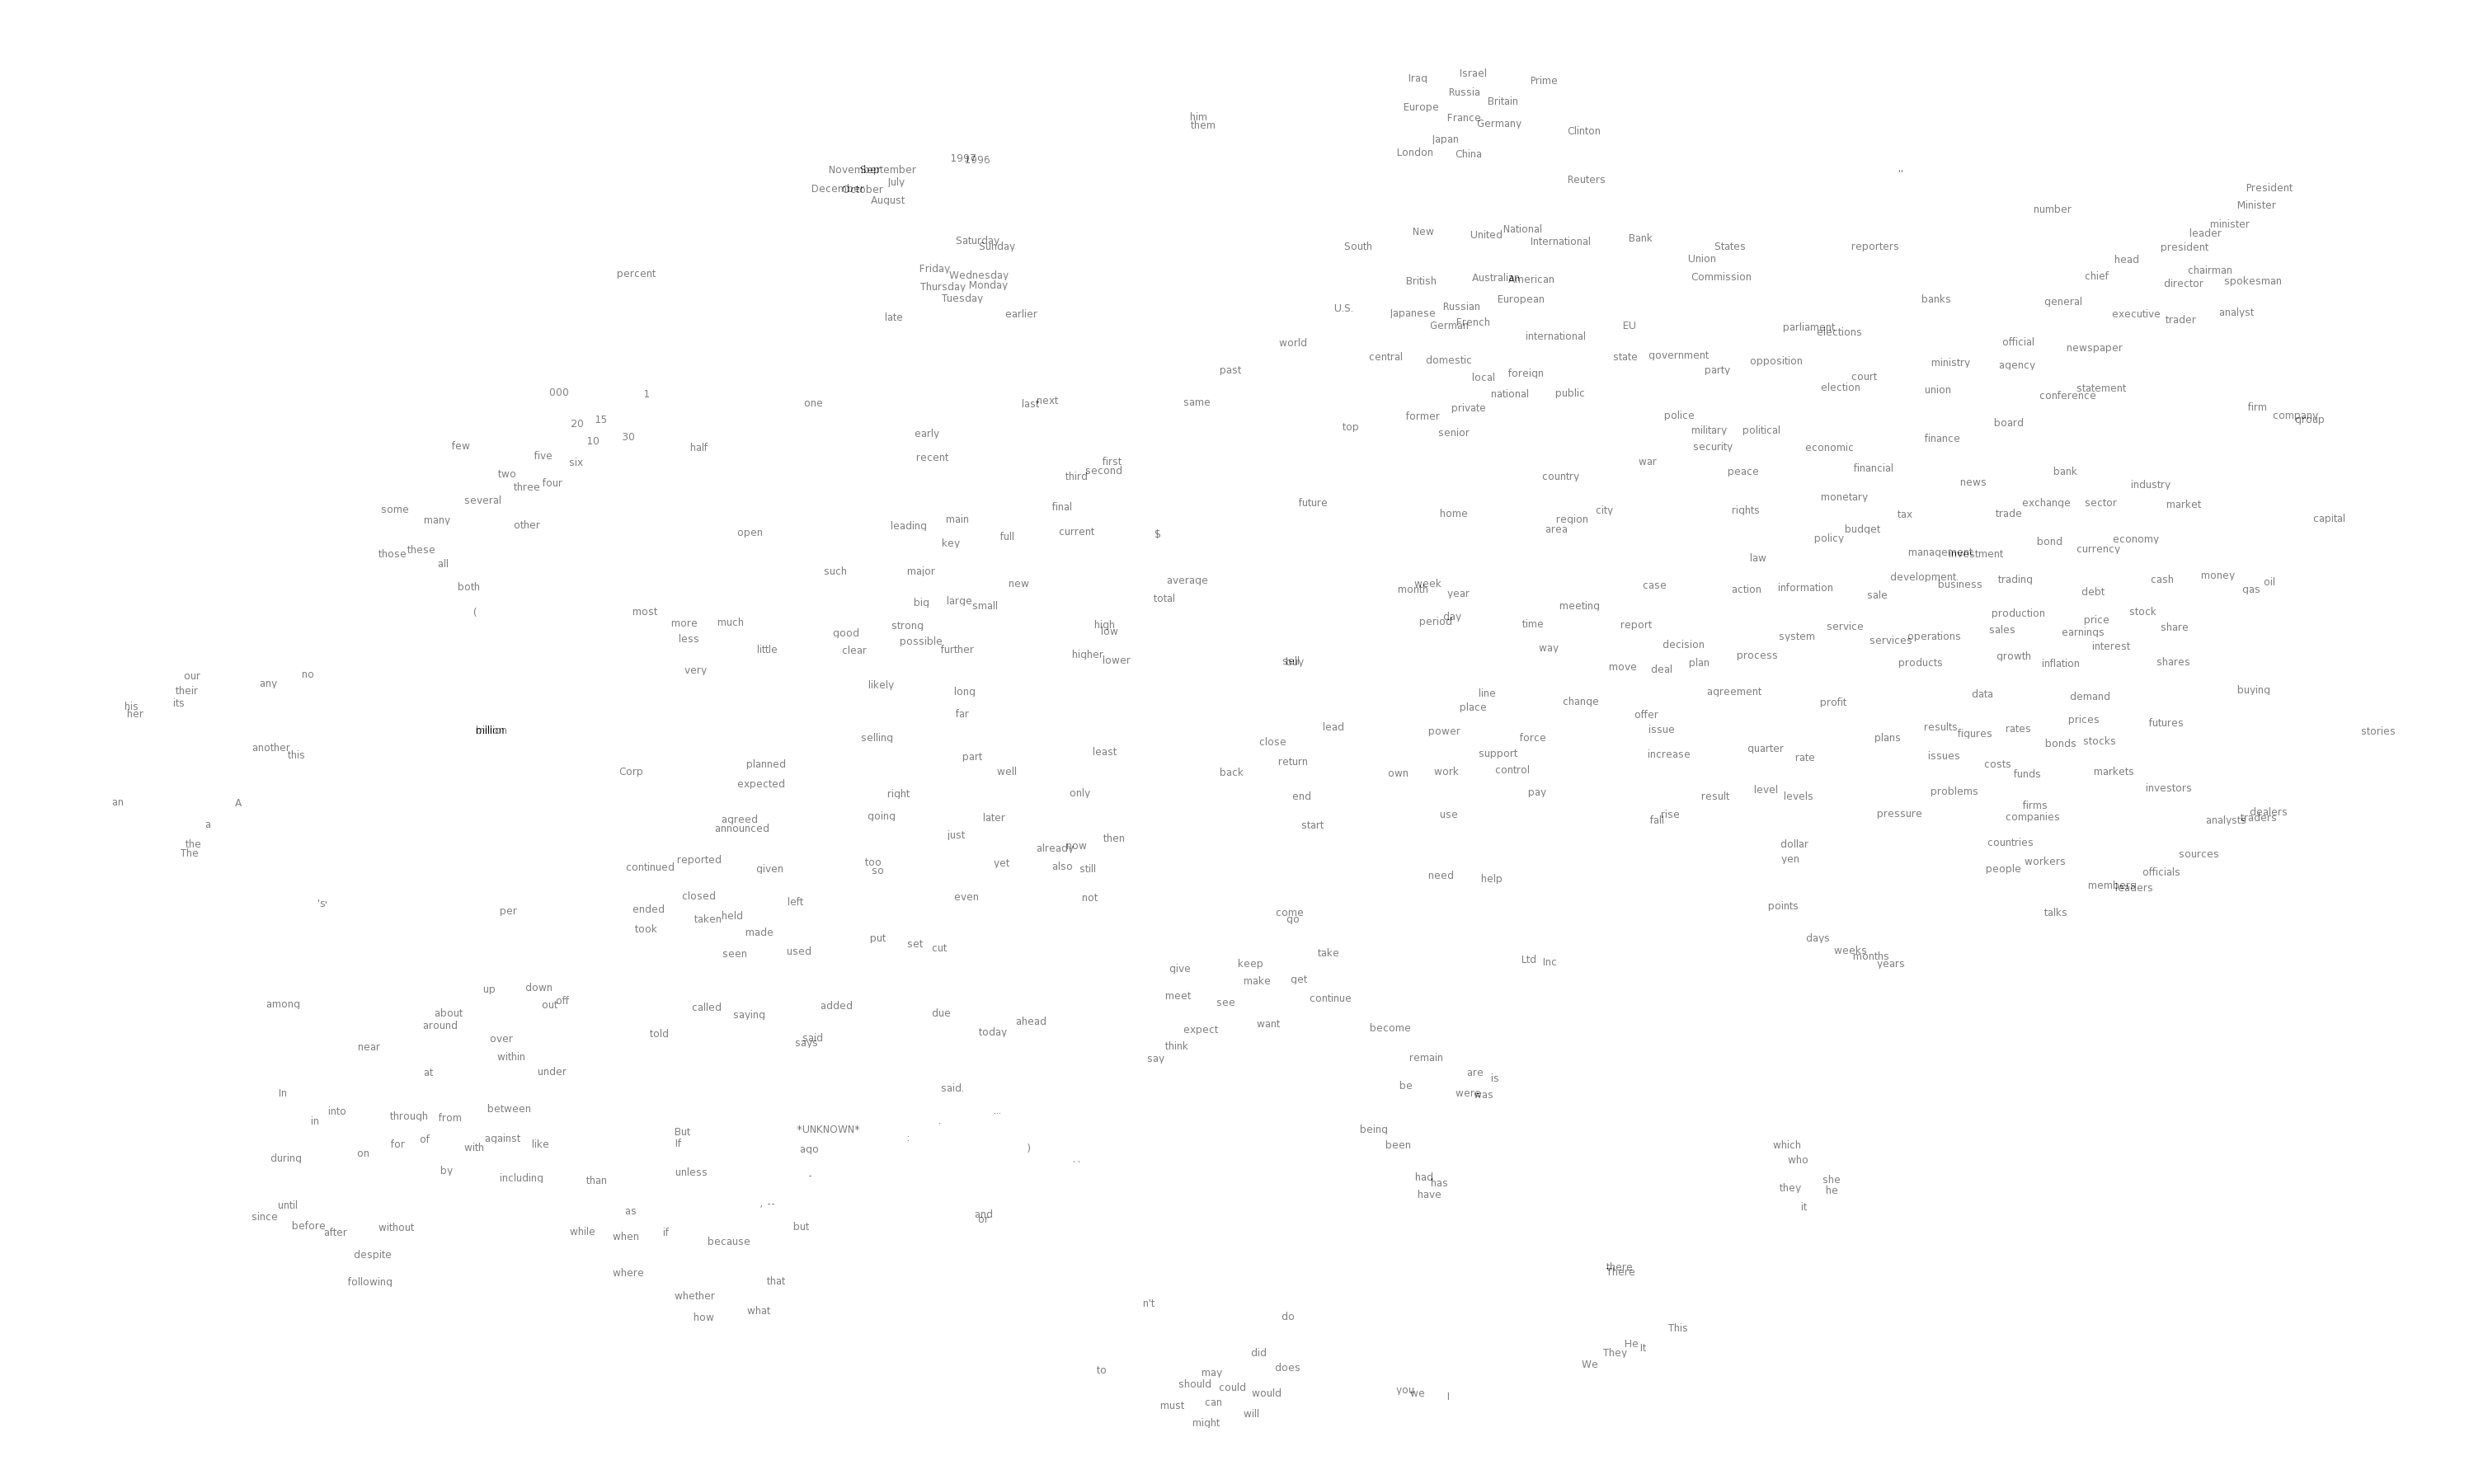
Also, some lovely examples of using t-SNE to visualize conv net representations: http://cs.stanford.edu/people/karpathy/cnnembed/
I think people have found it very useful as one of the main tools for understanding what deep models are doing (along with optimization-based feature visualization) and to just check that your model is learning. I haven't really heard about people using it to pick input features, but that's probably mostly because I don't really work with anyone doing feature engineering.
Re: How to Use t-SNE Effectively
#4Has anyone here used t-SNE for visualization of their high dimensional data for machine learning? Were you able to ensure that your feature space was good via t-SNE?
t-SNE is used very widely in ML, both to analyze input data and to analyze learned representations. To me, the canonical example of people using t-SNE this way is visualizing word embeddings, like this: http://metaoptimize.s3.amazonaws.com/cw-embeddings-ACL2010/e... Also, some lovely examples of using t-SNE to visualize conv net representations: http://cs.stanford.edu/people/karpathy/cnnembed/ I think people have fou…
> t-SNE is used very widely in ML, both to analyze input data and to analyze learned representations.
I was wondering if t-SNE could be used to know the "goodness" of your selected features for the prediction task. In the sense, t-SNE could be used as an indicator for feature selection. I was wondering if some people have successfully used t-SNE for feature selection and in what cases.
Edit - Off Topic : Cool, homepage/blog.
Re: How to Use t-SNE Effectively
#5Has anyone here used t-SNE for visualization of their high dimensional data for machine learning? Were you able to ensure that your feature space was good via t-SNE?
I made an interactive visualization which clustered ~10,000 news headlines (converted to 50D with word2vec) via t-SNE to help illustrate groups of clickbait headlines: http://minimaxir.com/2016/08/clickbait-cluster/
I did not hyper optimize parameters for that visualization, so I find this post interesting. Additionally, it was pointed out afterward that I may have cheated slightly in terms of labeling by feeding the news source to the t-SNE algorithm.
Re: How to Use t-SNE Effectively
#6Are there standalone packages that can perform t-sne, or are we limited to using the versions in R, etc. ?
Re: How to Use t-SNE Effectively
#7Are there standalone packages that can perform t-sne, or are we limited to using the versions in R, etc. ?
There are plenty; This page contains a partial list: https://lvdmaaten.github.io/tsne/
Re: How to Use t-SNE Effectively
#8The article mentions that:
"There may not be one perplexity value that will capture distances across all clusters—and sadly perplexity is a global parameter. Fixing this problem might be an interesting area for future research."
There are some suggestions in the literature for fixing this. Michel Verleysen's group suggested a "multi-scale" approach:
https://www.elen.ucl.ac.be/Proceedings/esann/esannpdf/es2014...
http://dx.doi.org/10.1016/j.neucom.2014.12.095 (more details in this one, but behind a paywall)
Their approach is to calculate the input probabilities using multiple perplexities and use the average. They also suggest tweaking the output probabilities, but it uses a free parameter that isn't present in the standard formulation of t-SNE (their suggested algorithm takes the same approach as t-SNE, but uses a different cost function and output weighting function).
Re: How to Use t-SNE Effectively
#9Has anyone here used t-SNE for visualization of their high dimensional data for machine learning? Were you able to ensure that your feature space was good via t-SNE?
t-SNE is commonly used in single cell RNA sequencing experiments. These experiments use microfluidic technologies to profile the gene expression of thousands of single cells.
t-SNE is usually used on the top N (quite commonly N = 50) principle components. This tends to give good separation of different cell types.
A few papers examples are:
http://biorxiv.org/content/early/2016/07/26/065912 http://www.cell.com/abstract/S0092-8674(15)00549-8 http://www.cell.com/cell/abstract/S0092-8674(15)00500-0
Re: How to Use t-SNE Effectively
#10Has anyone here used t-SNE for visualization of their high dimensional data for machine learning? Were you able to ensure that your feature space was good via t-SNE?
t-SNE is commonly used in single cell RNA sequencing experiments. These experiments use microfluidic technologies to profile the gene expression of thousands of single cells. t-SNE is usually used on the top N (quite commonly N = 50) principle components. This tends to give good separation of different cell types. A few papers examples are: http://biorxiv.org/content/early/2016/07/26/065912 http://www.cell.com/abstra…
This sounds interesting. I am in a field where a lot more focus is on visualizing samples using different metrics with PcOA instead of using regular PCA.
If i just scroll through the Zheng et al arxiv paper it all seems a little arbitrary to me. Selecting a 1000 features, then 50 components. They argue that it is for computation time reasons, but is there any kind of benchmark suggesting this is a better strategy than just plotting the two first components or using MDS which also has the advantage in this scenario of being convex?