Live data from Hacker News

Textures.js – SVG patterns for Data Visualization

riccardoscalco.github.io

21–30 of 34 posts

Re: Textures.js – SVG patterns for Data Visualization

#21
post #12

I see a lot of relatively low level libraries for data visualization. Are there any very high level libraries, that allow regular coders like me to visualize some data quickly? I find myself needing this all the time, but I would prefer the simplest interface possible, rather than high configurability.

If you're familiar with Python, try the Jupyter notebook (jupyter.org) - very useful for quick visualizations while also allowing you to quickly transform the data when necessary. The big advantage is your interactive 'repl' session is persisted as well as editable so you can resume anytime.

You can use any one of a number of visualization libraries such as matplotlib, bokeh, and more. Here's a quick start for an idea of the code needed: http://nbviewer.jupyter.org/github/bokeh/bokeh-notebooks/blo...
Re: Textures.js – SVG patterns for Data Visualization

#22
post #12

I see a lot of relatively low level libraries for data visualization. Are there any very high level libraries, that allow regular coders like me to visualize some data quickly? I find myself needing this all the time, but I would prefer the simplest interface possible, rather than high configurability.

My advice is to bite the bullet and learn d3 (instead of a wrapper like dc.js or nvd3) if this is for any production level data. Or build in the time you will need to rewrite it for API nastiness and probably performance reasons down the line.

[deleted]

Re: Textures.js – SVG patterns for Data Visualization

#24
post #16
post #11

Earlier quoted context omitted.

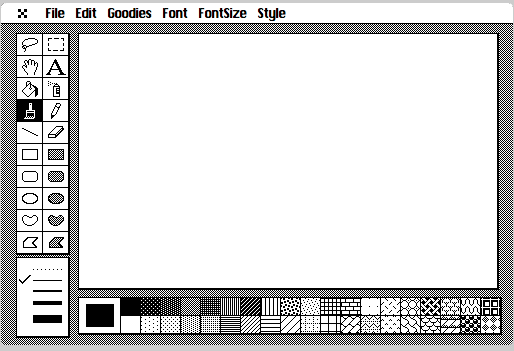
Tufte dismisses these types of patterns as "chartjunk" and "unintentional optical art"[0]. I'm not sure I agree completely - I think patterns can be used as an effective additional data dimension, but you certainly have to be careful not to overdo it. [0] http://www.edwardtufte.com/bboard/q-and-a-fetch-msg?msg_id=0...

> Tufte dismisses these types of patterns as "chartjunk" and "unintentional optical art" What Tufte doesn't understand is that your end goal isn't always information density and great insight. Sometimes aesthetics can be equally or more important than the data. Especially if the data are crap, like 90% of charts used in marketing ( ), where the marketing part is more important that actually showing something with the…

I think tufte understands that people make junk charts on purpose. I think he just doesn't agree that it's a good chart if the purpose isn't to actually inform truthfully . If your data is crap and you know it then basically you are misleading people on purpose. At that point it doesn't really matter if you have a lot of chartjunk as well.

Re: Textures.js – SVG patterns for Data Visualization

#25
post #2

Visually this looks very nice. I personally love your choice of colours for the website which compliments the retro look of pattern fills in general. What I'd like more information on, if possible, is whether or not such patterns are more effective, for communication, than regular colours. You're targeting D3 (as opposed to, say the printed page? Please confirm?), so I guess the question is, is this a visual candy (a…

Research in 1984 (Graphical Perception: Theory, Experimentation, and Application to the Development of Graphical Methods - by William S. Cleveland and Robert McGill - https://www.cs.ubc.ca/~tmm/courses/cpsc533c-04-spr/readings/...) found that texture (what they call shading) is worse than color saturation for discrimination of quantitative differences. For categorical discrimination it is probably as good as color if limited to a few patterns.

Re: Textures.js – SVG patterns for Data Visualization

#27
post #12

I see a lot of relatively low level libraries for data visualization. Are there any very high level libraries, that allow regular coders like me to visualize some data quickly? I find myself needing this all the time, but I would prefer the simplest interface possible, rather than high configurability.

I like http://metricsgraphicsjs.org/examples.htm which is built on d3

Re: Textures.js – SVG patterns for Data Visualization

#28
post #18

Love this style of documentation - very concise, concrete usage examples with a minimal amount of code needed to reproduce. I actually modeled the new documentation of Trianglify ( http://qrohlf.com/trianglify/ ) on the Textures.js docs. I don't have the numbers on hand, but subjectively the number of 'how do I do X' github issues that I deal with has gone down a lot since adopting this style of docs.

Both this and Textures look really slick, I love them both!

Re: Textures.js – SVG patterns for Data Visualization

#29
post #18

Love this style of documentation - very concise, concrete usage examples with a minimal amount of code needed to reproduce. I actually modeled the new documentation of Trianglify ( http://qrohlf.com/trianglify/ ) on the Textures.js docs. I don't have the numbers on hand, but subjectively the number of 'how do I do X' github issues that I deal with has gone down a lot since adopting this style of docs.

Couldn't agree more, and Trianglify looks super cool.
Post reply on HN