Clifford Attractors
paulbourke.net
Clifford Attractors
1–10 of 17 posts
Re: Clifford Attractors
#2There's a lot of noise in those images. You could reduce that by increasing the sample count significantly, which should be easy on modern GPUs. (I recognize the noise levels because I wrote a renderer for Clifford Attractors circa 2000, but back then, it took all night on a nice Mac G4 to get images with that kind of quality.) Maybe I'll post my OpenGL-based version.
Re: Clifford Attractors
#3Julien C. Sprott has a very fun, approachable, and free book on generating various kinds of strange attractor visualizations:
http://sprott.physics.wisc.edu/sa.htm
It has 1993-era code, which paradoxically might make it good for a coding beginner since you'd have to work a bit to figure out a basic syntactic translation, but the high level idea is already there. You get immediate visual results, and there is a lot of room to experiment and play.
Re: Clifford Attractors
#4Imma let you finish, but the Lorenz attractor is the best strange attractor of all time.
Re: Clifford Attractors
#5I wrote a renderer (eventually became Krakatoa) for these and similar systems developed by "Dr" Baily:
Was used (and still used) on a bunch of films for Krytonite, dream sequences, plasma, etc. The longest render time I remember for getting rid of noise was over 24Hrs and involved +1B computed samples of the underlying functions.
Re: Clifford Attractors
#6What determines alpha on those images? On any attractors really? You end up with an infinitely large set of points between say -1.5 and 2.0. How does that end up being graphed. Perhaps that is magic/beauty of it.
Re: Clifford Attractors
#7Neat site.
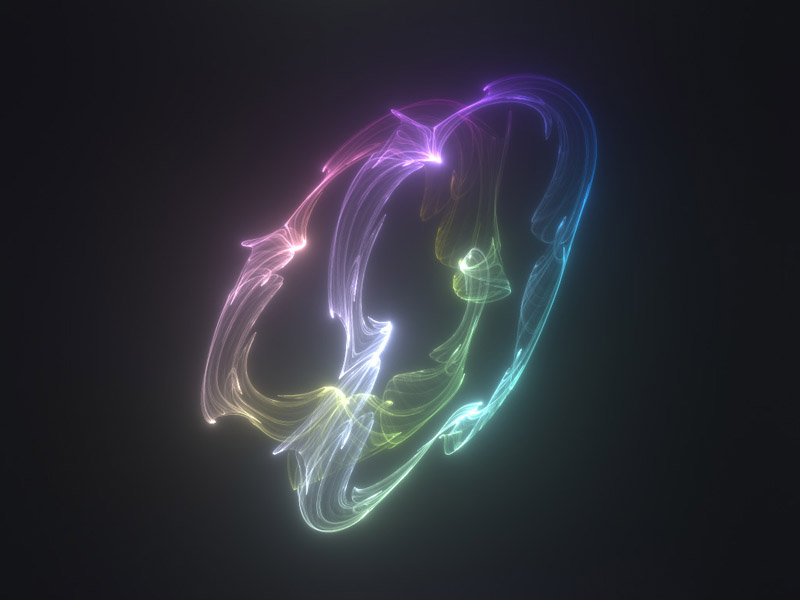
Someone should make a screensaver like the last two random attractors on: http://paulbourke.net/fractals/lyapunov/
http://paulbourke.net/fractals/lyapunov/explore1.jpg
http://paulbourke.net/fractals/lyapunov/explore2.jpg
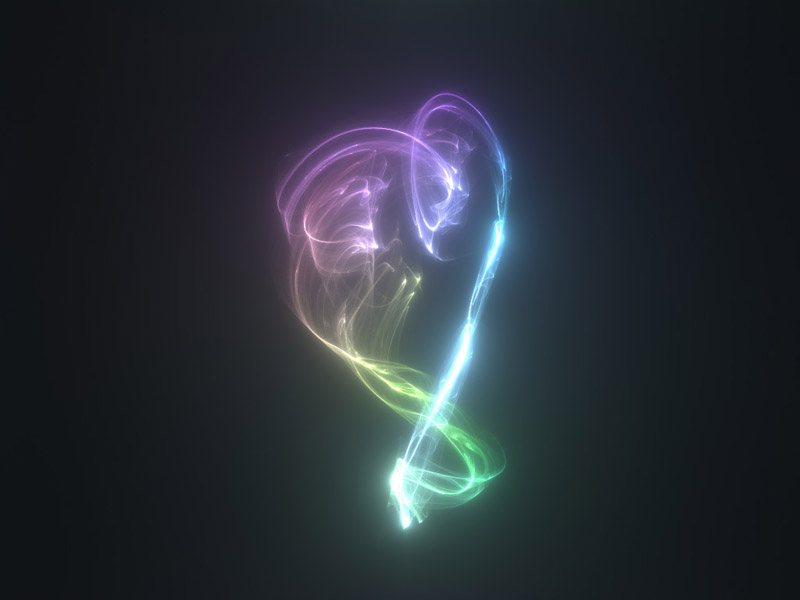
Those look badass.
Re: Clifford Attractors
#8What determines alpha on those images? On any attractors really? You end up with an infinitely large set of points between say -1.5 and 2.0. How does that end up being graphed. Perhaps that is magic/beauty of it.
I've done similar images in the past and the approach I used was:
1) Choose a target image resolution, and set up a square array of that size, initialized to zeroes.
2) Decide on the bounds you want to use, and linearly map coordinates into the target image. Say you want to graph x in the range [Xmin, Xmax) and your resolution is Xres, then pixel_x = (int)((x - Xmin) * Xres / (Xmax - Xmin)) (Note that if you have a higher-dimensional attractor you'll need some form of projection down to two dimensions.)
3) Iterate your attractor equation (starting point doesn't matter because it's an attractor). Each iteration, increment the pixel that matches your current coordinates. Stop iterating when you land on a pixel with a value above some preset.
4) Apply a palette to your pixel values to turn it into a nice picture like the ones linked here.
Re: Clifford Attractors
#9What determines alpha on those images? On any attractors really? You end up with an infinitely large set of points between say -1.5 and 2.0. How does that end up being graphed. Perhaps that is magic/beauty of it.
I think it's determined by resolution and number of iterations.
I wrote a quick JS vesrion using the provided formulas: http://bl.ocks.org/gunn/87401cb547cc2ee5b5ec
Re: Clifford Attractors
#10I spent some time rendering these sorts of attractors back between 1995 and 2004, influenced by Pickover and Sprott...
http://technocosm.org/chaos/gallery.html
Pardon me for not updating the site to modern standards, the html is very late 90s.