Live data from Hacker News

An insider’s story of the global attack on climate science

arstechnica.com

91–94 of 94 posts

Re: An insider’s story of the global attack on climate science

#91
post #89

Earlier quoted context omitted.

Once again that what is being predicted is confimed every day on different independent places by different independent teams. If you don't understand the details and close your eyes to the fact that the "predictions" are confirmed by the different scientists in fully different research areas, then there's nothning anybody can do.

I really wish you would directly answer the question I've asked in several previous posts: What is the window of time you feel confident predicting the average global temperature? Initially I asked about an average within 2014, but you implied from your ant analogy that was too small of a window. So, what is a reasonable window of time and what is the predicted value?

"The Earth's average surface temperature rose by 0.74+-0.18 °C over the period 1906–2005. The rate of warming over the last half of that period was almost double that for the period as a whole (0.13±0.03 °C per decade)."

Look at the graph:

http://upload.wikimedia.org/wikipedia/commons/f/f9/Enso-glob...
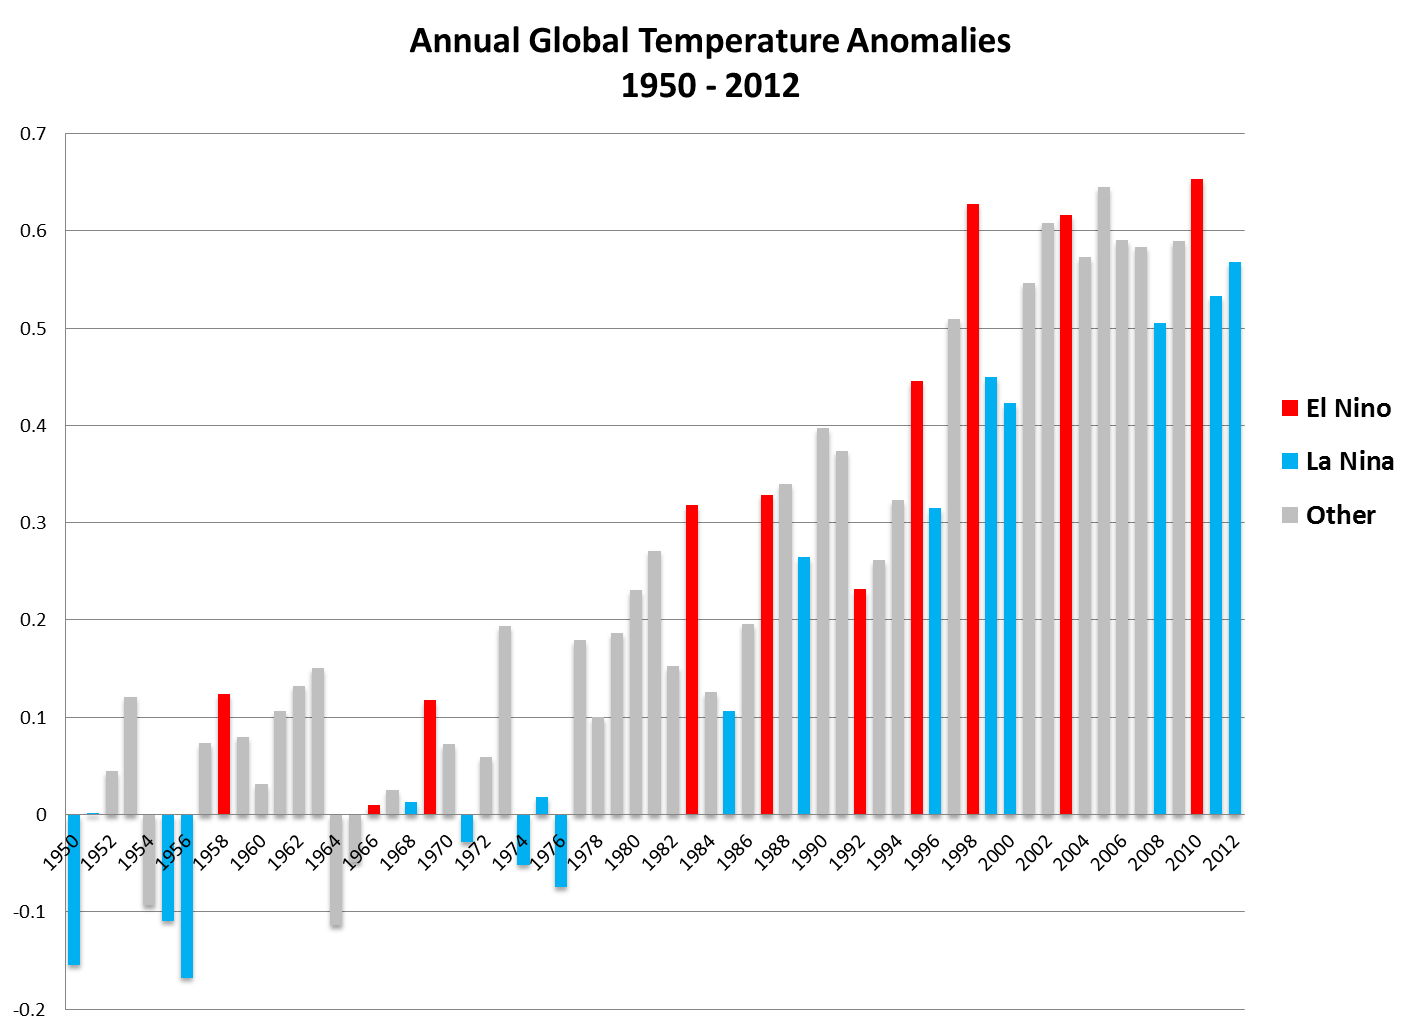
If you would try to understand the numbers you would also understand that in the given limits we can exactly predict, and our observations already match the predictions. It's getting warmer, with the deviations which exist every year. Just like creek water has the flow where you don't know where every drop is but you can observe the flow. It's simply the nature of that.

It is getting warmer, exactly as we predict. And humans are the cause. We proved that too.

Re: An insider’s story of the global attack on climate science

#92
post #91

Earlier quoted context omitted.

I really wish you would directly answer the question I've asked in several previous posts: What is the window of time you feel confident predicting the average global temperature? Initially I asked about an average within 2014, but you implied from your ant analogy that was too small of a window. So, what is a reasonable window of time and what is the predicted value?

"The Earth's average surface temperature rose by 0.74+-0.18 °C over the period 1906–2005. The rate of warming over the last half of that period was almost double that for the period as a whole (0.13±0.03 °C per decade)." Look at the graph: http://upload.wikimedia.org/wikipedia/commons/f/f9/Enso-glob... If you would try to understand the numbers you would also understand that in the given limits we can exactly predict…

That's a graph of the past...

I really don't feel like I'm asking for something crazy. Just like from 2013-2023 the average temp will be X. Or if that is too short, from 2013-2050 the average temp will by Y.

For a theory that claims to predict the future climate, I'm having a hard time getting a concrete prediction of the future climate.

Or could it be that the science is still evolving on this incredibly complex system...

Re: An insider’s story of the global attack on climate science

#93
post #91

Earlier quoted context omitted.

"The Earth's average surface temperature rose by 0.74+-0.18 °C over the period 1906–2005. The rate of warming over the last half of that period was almost double that for the period as a whole (0.13±0.03 °C per decade)." Look at the graph: http://upload.wikimedia.org/wikipedia/commons/f/f9/Enso-glob... If you would try to understand the numbers you would also understand that in the given limits we can exactly predict…

That's a graph of the past... I really don't feel like I'm asking for something crazy. Just like from 2013-2023 the average temp will be X. Or if that is too short, from 2013-2050 the average temp will by Y. For a theory that claims to predict the future climate, I'm having a hard time getting a concrete prediction of the future climate. Or could it be that the science is still evolving on this incredibly complex sys…

The climate research is not the weather forecasting. I wanted to give you an idea how litle sense has to predict for any particular year. The Earth doesn't function that way. The trend however is absolutely predictable.

For the future, look here (the Figure SPM.10 from the last IPCC report, PDF linked later):

http://www.easterbrook.ca/steve/2013/10/what-does-the-new-ip...

What will happen depends only on our fossil fuel consumption. The last IPCC reports does predictions for different "Representative Concentration Pathways": Simulations were performed with prescribed CO2 concentrations reaching 421 ppm (RCP2.6), 538 ppm (RCP4.5), 670 ppm (RCP6.0), and 936 ppm (RCP 8.5) by the year 2100.

It you know we're already over 400 ppm, drop the RCP2.6 (dark blue) curve, since to achieve it we have to soon stop consuming fossil fuels (Figure 12.46).

By 2100 it will be between 1.5 and 4 degrees warmer than now, depending on how much we're ready to cut our fossil fuels use. And that is immense increase. We already observe significant differences between now and hundred years ago everywhere, which was only 0.85 deg C difference!

The "short" report (PDF) is:

http://www.climatechange2013.org/images/uploads/WGI_AR5_SPM_...

The full report is huge so I link the top page:

http://www.ipcc.ch/report/ar5/wg1/

"Climate Change 2013: The Physical Science Basis"

Re: An insider’s story of the global attack on climate science

#94
post #86

Earlier quoted context omitted.

Well, after searching, it appears there is a book that does exactly this. I'm going to read it, and then maybe I will have a better idea of what the relative cost benefits are. https://www.amazon.com/gp/digital/fiona/thank-you?ie=UTF8&a=...

Link's busted.

"How to Spend $75 Billion to Make the World a Better Place" - I'm about halfway through, but according to this Copenhagen consensus group, which appears to be made up of Nobel prize-winning scientists, the ROI for global warming mitigation is negative (using the same methodology they applied to the other items they were considering).
Post reply on HN