Glad to see someone finally understands the limitations of files and folders in IDEs. Let me suggest that your next step might be cooperative development as opposed to solo development. Hiveware for SoftwareDevelopment (not yet developed) would let Light Table users develop a single project's functions cooperatively and simultaneously without merge. Check out www.grammarapps.com to get an idea of the technology.
Light Table - a new IDE concept
301–310 of 315 posts
Re: Light Table - a new IDE concept
#302Earlier quoted context omitted.
/** * Auto-generated, do not edit! */ function add(x, y) { /* test 1 */ if (x == 2 && y == 2) { return 4; } /* test 2 */ if (x == 1 && y == -1) { return 0; } }
Simple. Do some monte carlo comparisons between a large number of generated functions, based on various heuristics like number of instructions. So quickly get rid of explicit mapping of tests, especially if used larger. Add some genetic algorithms and a little more AI stuff ;) One interesting thing though with auto-generated code based on specific test code is that when the test fails at some point the process just h…
Why not jump to prolog if you want to want to declare what the properties of the code are and have the compiler figure out how to actually do it?
Re: Light Table - a new IDE concept
#303Earlier quoted context omitted.
(1) You're right, I should have explained that more. I wanted to contrast this with something like "spreadsheets today have a datum-flow model" but a nice phrasing didn't come to me and I posted without remembering to insert the missing sentence. What I mean is that spreadsheets are (right now) fundamentally based on the idea of a grid of cells which are individually meaningless and can contain anything, any individu…
Interesting. It seems our views are similar on some aspects of this and divergent in others. I agree with you that the cell-based referencing system that treats every individual datum independently is too low-level and can lead to arbitrary spaghetti. (Boy do I know that spaghetti. I have been doing battle with that spaghetti. Or more precisely, with the computational model that you correctly describe as allowing for…
Just to answer your question with regards to (2):
Suppose I open up LibreOffice Calc, and my first row gets the values "c", "x", "y" in that order, as labels for three columns. The second row gets the values 2, -2, 0. The third row gets the odd formulas:
=A2, =B2 + 0.02, =B3 * B3 + A3 * B3 - 1
The key thing is, this "dragging autofill" has quickly managed to make all of the y computations dependent on the same c, whose authoritative value is stored at cell A2. (I can also change what x's I look at by tweaking the cell B2.)
So I highlight the x and y columns, click the Chart button, to do a scatterplot, lines only -- no point markers. Then I need to kill the autoadjustment of the y axis because it will confuse me, so I set it to go from y = -5 to +10.
Now I can just start modifying this parameter c in cell A2, and see how the graph changes. I might notice for example that the vertex of the parabola hits a maximum when c = 0. That's an interesting feature; it suggests that the vertex of the parabola describes its own parabola as you vary c. Et cetera.
The only reason for doing it this way is because that is the easiest way I know of to get the computation right for 200 data cells. You're right, I could hand-write 200 different computations to all point to A2. It would take a long time and I would hate my life. I could also write in the value "2" and whenever I want to change it, drag across 200 rows. But then I would never get to see how this thing changes. (If you've never seen it, see Bret Victor's "Inventing on Principle" talk for a discussion of the power of having a direct connection with your artistic creations.)
Re: Light Table - a new IDE concept
#304Earlier quoted context omitted.
> Isn't it ironic that this is posted on a site that does startup funding and the comments are "please put this on kickstarter" not "please apply for Y Combinator"? Why, one can do both :). (eg. Pebble is funded by Kickstarter, but the creators are an YC company) Anyway, the most important thing is: make it happen, make it happen fast, and don't let it become another CodeBubbles - an IDE idea with a video that captur…
AFAIK Code Bubbles is now Debugger Canvas http://msdn.microsoft.com/en-us/devlabs/debuggercanvas
Kind of. Code Bubbles inspired a few of us (mostly steven schermerhorn + chris) to write a prototype of it for VS called Codeporium, which was at least part of what made it into debugger canvas. Of course, we didn't do any of the hard work (like getting the debugger working), so I'm not sure how much credit we should get :) Chris probably remembers more about it than I do.
Re: Light Table - a new IDE concept
#305Hi, I develop in Python and js. Idle is ok, but I'm sick and tired of Eclipse and I almost freaked out when I saw your article. The video seems pretty awesome and after taking a peep at the code, I'm thinking of learning Clojure just to be able to participate in the project. Visual Studio has finally proven itself useful (developing in it make you imagine better ways to develop software apparently) XD
My request is if you have some link for a let's say "decent" coder who wants to understand and maybe try to compile the code on his own computer (debian). Perhaps even recommend an IDE for Clojure until this one is ready.
Re: Light Table - a new IDE concept
#306Earlier quoted context omitted.
I'd be interested to hear your thoughts on LabVIEW, if you've ever used it: http://www.ni.com/labview/ . It's a graphical programming language with an emphasis on system design (for scientists and engineers) that uses a dataflow paradigm (amongst other things) and has a unique UI creation system. (Disclaimer: I work for National Instruments and my comments here in no way reflect the views of National Instruments and…
The whole time I was using LabVIEW (for a class) I kept dreaming of the days when I'd be done with it and back to a typed language.
That's the sentiment that's been conveyed to me when visiting a few university classes that make use of LabVIEW. I think that a great number of programmers that come from textual programming languages (I'm one of them) find the environment jarring as we try to force LabVIEW to fit norms we've built through out experiences in other languages. I think this is a combination of poor educational material catered towards dispelling projected similarities between graphical and textual programming languages and less than great communication beyond the scientific engineering user base of what LabVIEW is really great at.
In any case, thank you for the feedback, it's always great to hear back from fellow programmers that have had experiences with LabVIEW.
Re: Light Table - a new IDE concept
#307Earlier quoted context omitted.
I'd be interested to hear your thoughts on LabVIEW, if you've ever used it: http://www.ni.com/labview/ . It's a graphical programming language with an emphasis on system design (for scientists and engineers) that uses a dataflow paradigm (amongst other things) and has a unique UI creation system. (Disclaimer: I work for National Instruments and my comments here in no way reflect the views of National Instruments and…
My experience with LabVIEW, for the brief amount of time I worked with it for our high school robotics team, was slightly frustrating. I liked the dataflow paradigm, and to some degree the dashboard system, but connecting and managing the "wires" was a pain. Especially since I'm more comfortable/faster with a keyboard than I am with a mouse. It also seemed to be harder to read and understand the flow of the code, whi…
I understand the frustration. I've run into from a few of my students on the FTC teams that I mentor in my neighborhood. I think that this can be attributed to a lack of really great educational material (there is good stuff out there, but it can be hard to find when the build season really picks up), but on the flip side, I've seen kids in elementary school pick up the basics of dataflow programming, especially when working with the NXT-G software that comes with the Mindstorms NXT.
It's definitely a tool and one should always use the best tool for the job. Sometimes the best tool is not necessarily the one with the most suited features, but the one that you're most adept at using. Either way, thanks for the input, really. It helps a lot to understand what people walk away with when they use a product you've been a part of, and I love that HN users are honest and gracious in their feedback. Cheers.
Re: Light Table - a new IDE concept
#308I've unfortunately had to spend a great deal of time working with Labview (a graphical engineering software development environment that works based on data flow. Functions are represented by blocks with terminals for input and output data. You wire functions together to pass data between them). Some aspects are horrible (primarily the maintainability of anything more than a trivial application), but they also do som…
If you wouldn't mind me (your friendly, neighborhood National Instruments programmer browsing HN) asking, could you expound a little more on other things you've found horrible with LabVIEW?
I completely understand your sentiment on debugging and maintainability. I've done my fair share of quick-and-dirty apps that did one little thing wrong and a million highlighted executions and five years later, I've finally got a handle on what's wrong (mind you, I'm nowhere near a LabVIEW expert).
I love our documentation tool as well. We call it Context Help, and as you highlight over different parts of your code diagram, it's handy to see a quick, readable summary with links to full documentation for every single node and system available in LabVIEW.
If only all IDEs had the same functionality and it's the reason why I'm super psyched to see Light Table come out. Ready to be blown away.
Re: Light Table - a new IDE concept
#309Earlier quoted context omitted.
There's an aspect of that, too. I'm especially influenced by the circuit diagrams in G, the language which you program in when using LabVIEW. Basically most of the system, except for loops, looks like one big circuit. (Since loops are ugly because they're nonfunctional, I have wasted some time trying to think of what the Haskell version of G would look like, how you would embed monads in the circuit elements, and so…
Can you point to an example of a nontrivial program in G that does something people would normally do in a spreadsheet?
The best reference I can show for the general programming model was a blog post which is not in G, but was called "Why Concatenative Programming Matters":
http://evincarofautumn.blogspot.com/2012/02/why-concatenativ...
which shows you how graphical diagrams can make sense out of concatenative programs.
If you really want an example, then I will give you this with some caution:
http://team358.org/files/programming/ControlSystem2009-/LabV...
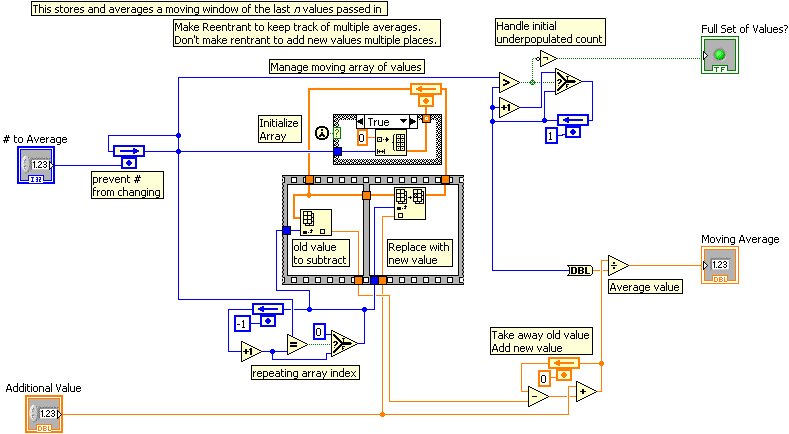
The caution is that LabVIEW views a data source as a sort of continuous input stream, so that it is manipulating individual values at any given time. I would rather view vectors as more fundamental in a spreadsheet language.
Re: Light Table - a new IDE concept
#310Love the demo! Where to download?