Live data from Hacker News

A 40-line fix eliminated a 400x performance gap

questdb.com

31–40 of 81 posts

Re: A 40-line fix eliminated a 400x performance gap

#31
post #30

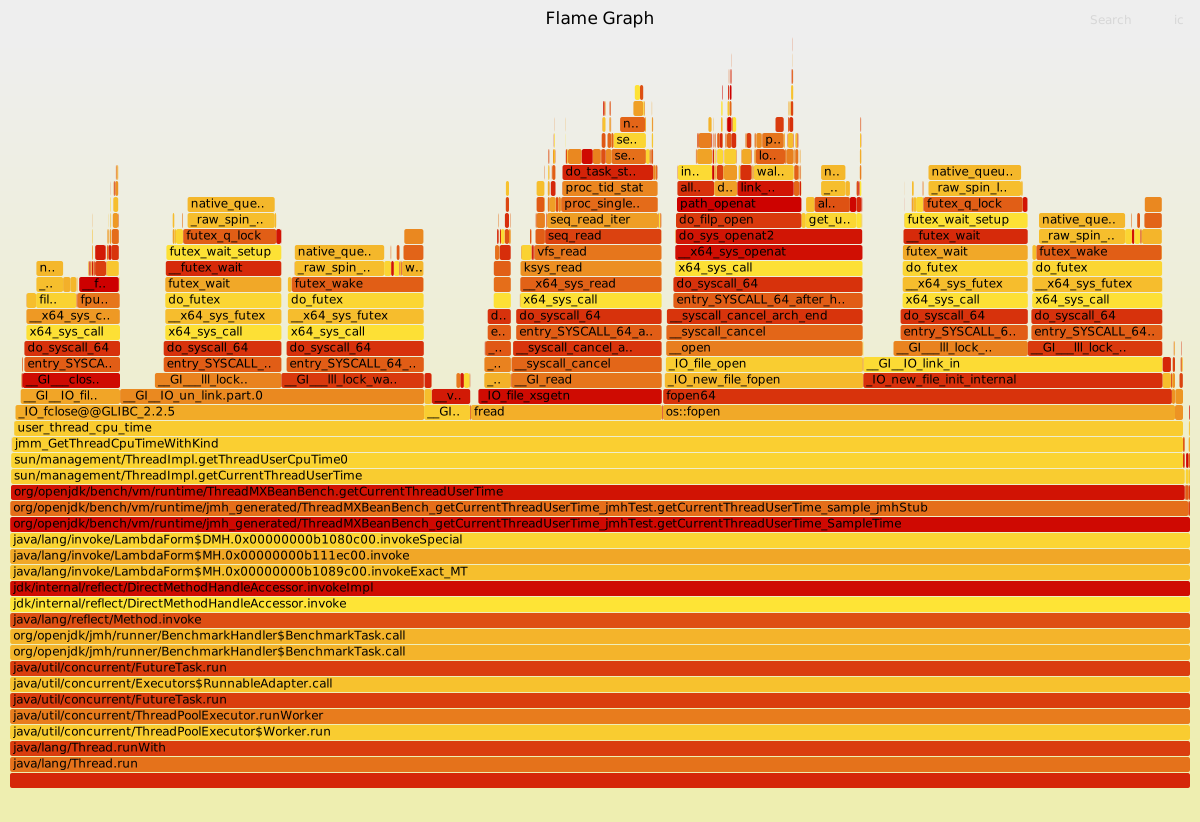
Flamegraphs are wonderful. Me: looks at my code. "sure, ok, looks alright." Me: looks at the resulting flamegraph. "what the hell is this?!?!?" I've found all kinds of crazy stuff in codebases this way. Static initializers that aren't static, one-line logger calls that trigger expensive serialization, heavy string-parsing calls that don't memoize patterns, etc. Unfortunately some of those are my fault.

I might be very wrong in every way but, string parsing and or manipulating and memoiziation... sound like a super strange combo? For the first you know you're already doing expensive allocations, but the 2nd is also not a pattern I really see apart from in JS codebases. Could you provide more context on how this actually bit you in the behind? memoizing strings seems like a complicated and error prone "welp it feels…

> but the 2nd is also not a pattern I really see apart from in JS codebases.

If you're referring to "one-line logger calls that trigger expensive serialization", it's also common in java.
Re: A 40-line fix eliminated a 400x performance gap

#32
post #2

Author here. After my last post about kernel bugs, I spent some time looking at how the JVM reports its own thread activity. It turns out that "What is the CPU time of this thread?" is/was a much more expensive question than it should be.

[dead]

Re: A 40-line fix eliminated a 400x performance gap

#33
post #7

Earlier quoted context omitted.

Stability and accuracy, when applied to clocks, are generally about dynamic range, i.e. how good is the scale with which you are measuring time. So if you're talking about nanoseconds across a long time period, seconds or longer, then yeah, you probably should care about your clock. But when you're measuring nanoseconds out of a millisecond or microsecond, it really doesn't matter that much and you're going to be OK…

This setup is a user space program on a machine that is not exclusively dedicated to the test running all kinds of interrupts (and other tasks) left, right and center through the software under test.

For something like this, you can just take several trials and look at the minimum observed time, which is when there will have been ~no interruptions.

https://github.com/facebook/folly/blob/main/folly/docs/Bench...

Re: A 40-line fix eliminated a 400x performance gap

#34

It took seven years to address this concern following the initial bug report (2018). That seems like a lot, considering how instrumenting CPU time can be in the hot path for profiled code.

400x slower than 70ns is still only 28us. How often is the JVM calling this function?

Re: A 40-line fix eliminated a 400x performance gap

#35

Flamegraphs are wonderful. Me: looks at my code. "sure, ok, looks alright." Me: looks at the resulting flamegraph. "what the hell is this?!?!?" I've found all kinds of crazy stuff in codebases this way. Static initializers that aren't static, one-line logger calls that trigger expensive serialization, heavy string-parsing calls that don't memoize patterns, etc. Unfortunately some of those are my fault.

Also cool that when you open it in a new tab, the svg [0] is interactive! You can zoom in by clicking on sections, and there's a button to reset the zoom level.

[0]: https://questdb.com/images/blog/2026-01-13/before.svg

Re: A 40-line fix eliminated a 400x performance gap

#36

Flamegraphs are wonderful. Me: looks at my code. "sure, ok, looks alright." Me: looks at the resulting flamegraph. "what the hell is this?!?!?" I've found all kinds of crazy stuff in codebases this way. Static initializers that aren't static, one-line logger calls that trigger expensive serialization, heavy string-parsing calls that don't memoize patterns, etc. Unfortunately some of those are my fault.

I've never used flamegraphs but would like to know about them. Can you explain more? Or where should I start?

Re: A 40-line fix eliminated a 400x performance gap

#37
post #33

Earlier quoted context omitted.

This setup is a user space program on a machine that is not exclusively dedicated to the test running all kinds of interrupts (and other tasks) left, right and center through the software under test.

For something like this, you can just take several trials and look at the minimum observed time, which is when there will have been ~no interruptions. https://github.com/facebook/folly/blob/main/folly/docs/Bench...

You don't actually know that for sure. You have only placed a new upper bound.

Re: A 40-line fix eliminated a 400x performance gap

#38

Flamegraphs are wonderful. Me: looks at my code. "sure, ok, looks alright." Me: looks at the resulting flamegraph. "what the hell is this?!?!?" I've found all kinds of crazy stuff in codebases this way. Static initializers that aren't static, one-line logger calls that trigger expensive serialization, heavy string-parsing calls that don't memoize patterns, etc. Unfortunately some of those are my fault.

I've never used flamegraphs but would like to know about them. Can you explain more? Or where should I start?

Flame graphs have an official web site, maintained by Brendan Gregg, who invented them: https://www.brendangregg.com/flamegraphs.html. It's a useful starting point.

Re: A 40-line fix eliminated a 400x performance gap

#39
post #30

Flamegraphs are wonderful. Me: looks at my code. "sure, ok, looks alright." Me: looks at the resulting flamegraph. "what the hell is this?!?!?" I've found all kinds of crazy stuff in codebases this way. Static initializers that aren't static, one-line logger calls that trigger expensive serialization, heavy string-parsing calls that don't memoize patterns, etc. Unfortunately some of those are my fault.

I might be very wrong in every way but, string parsing and or manipulating and memoiziation... sound like a super strange combo? For the first you know you're already doing expensive allocations, but the 2nd is also not a pattern I really see apart from in JS codebases. Could you provide more context on how this actually bit you in the behind? memoizing strings seems like a complicated and error prone "welp it feels…

In Java it can be a bad toString() implementation hiding behind a + used for string assembly.

Or another great one: new instances of ObjectMapper created inside a method for a single call and then thrown away.

Re: A 40-line fix eliminated a 400x performance gap

#40
post #30

Earlier quoted context omitted.

I might be very wrong in every way but, string parsing and or manipulating and memoiziation... sound like a super strange combo? For the first you know you're already doing expensive allocations, but the 2nd is also not a pattern I really see apart from in JS codebases. Could you provide more context on how this actually bit you in the behind? memoizing strings seems like a complicated and error prone "welp it feels…

In Java it can be a bad toString() implementation hiding behind a + used for string assembly. Or another great one: new instances of ObjectMapper created inside a method for a single call and then thrown away.

To be clear this is often sloppy code that shouldn’t have been written. But in a legacy codebase this stuff can easily happen.
Post reply on HN