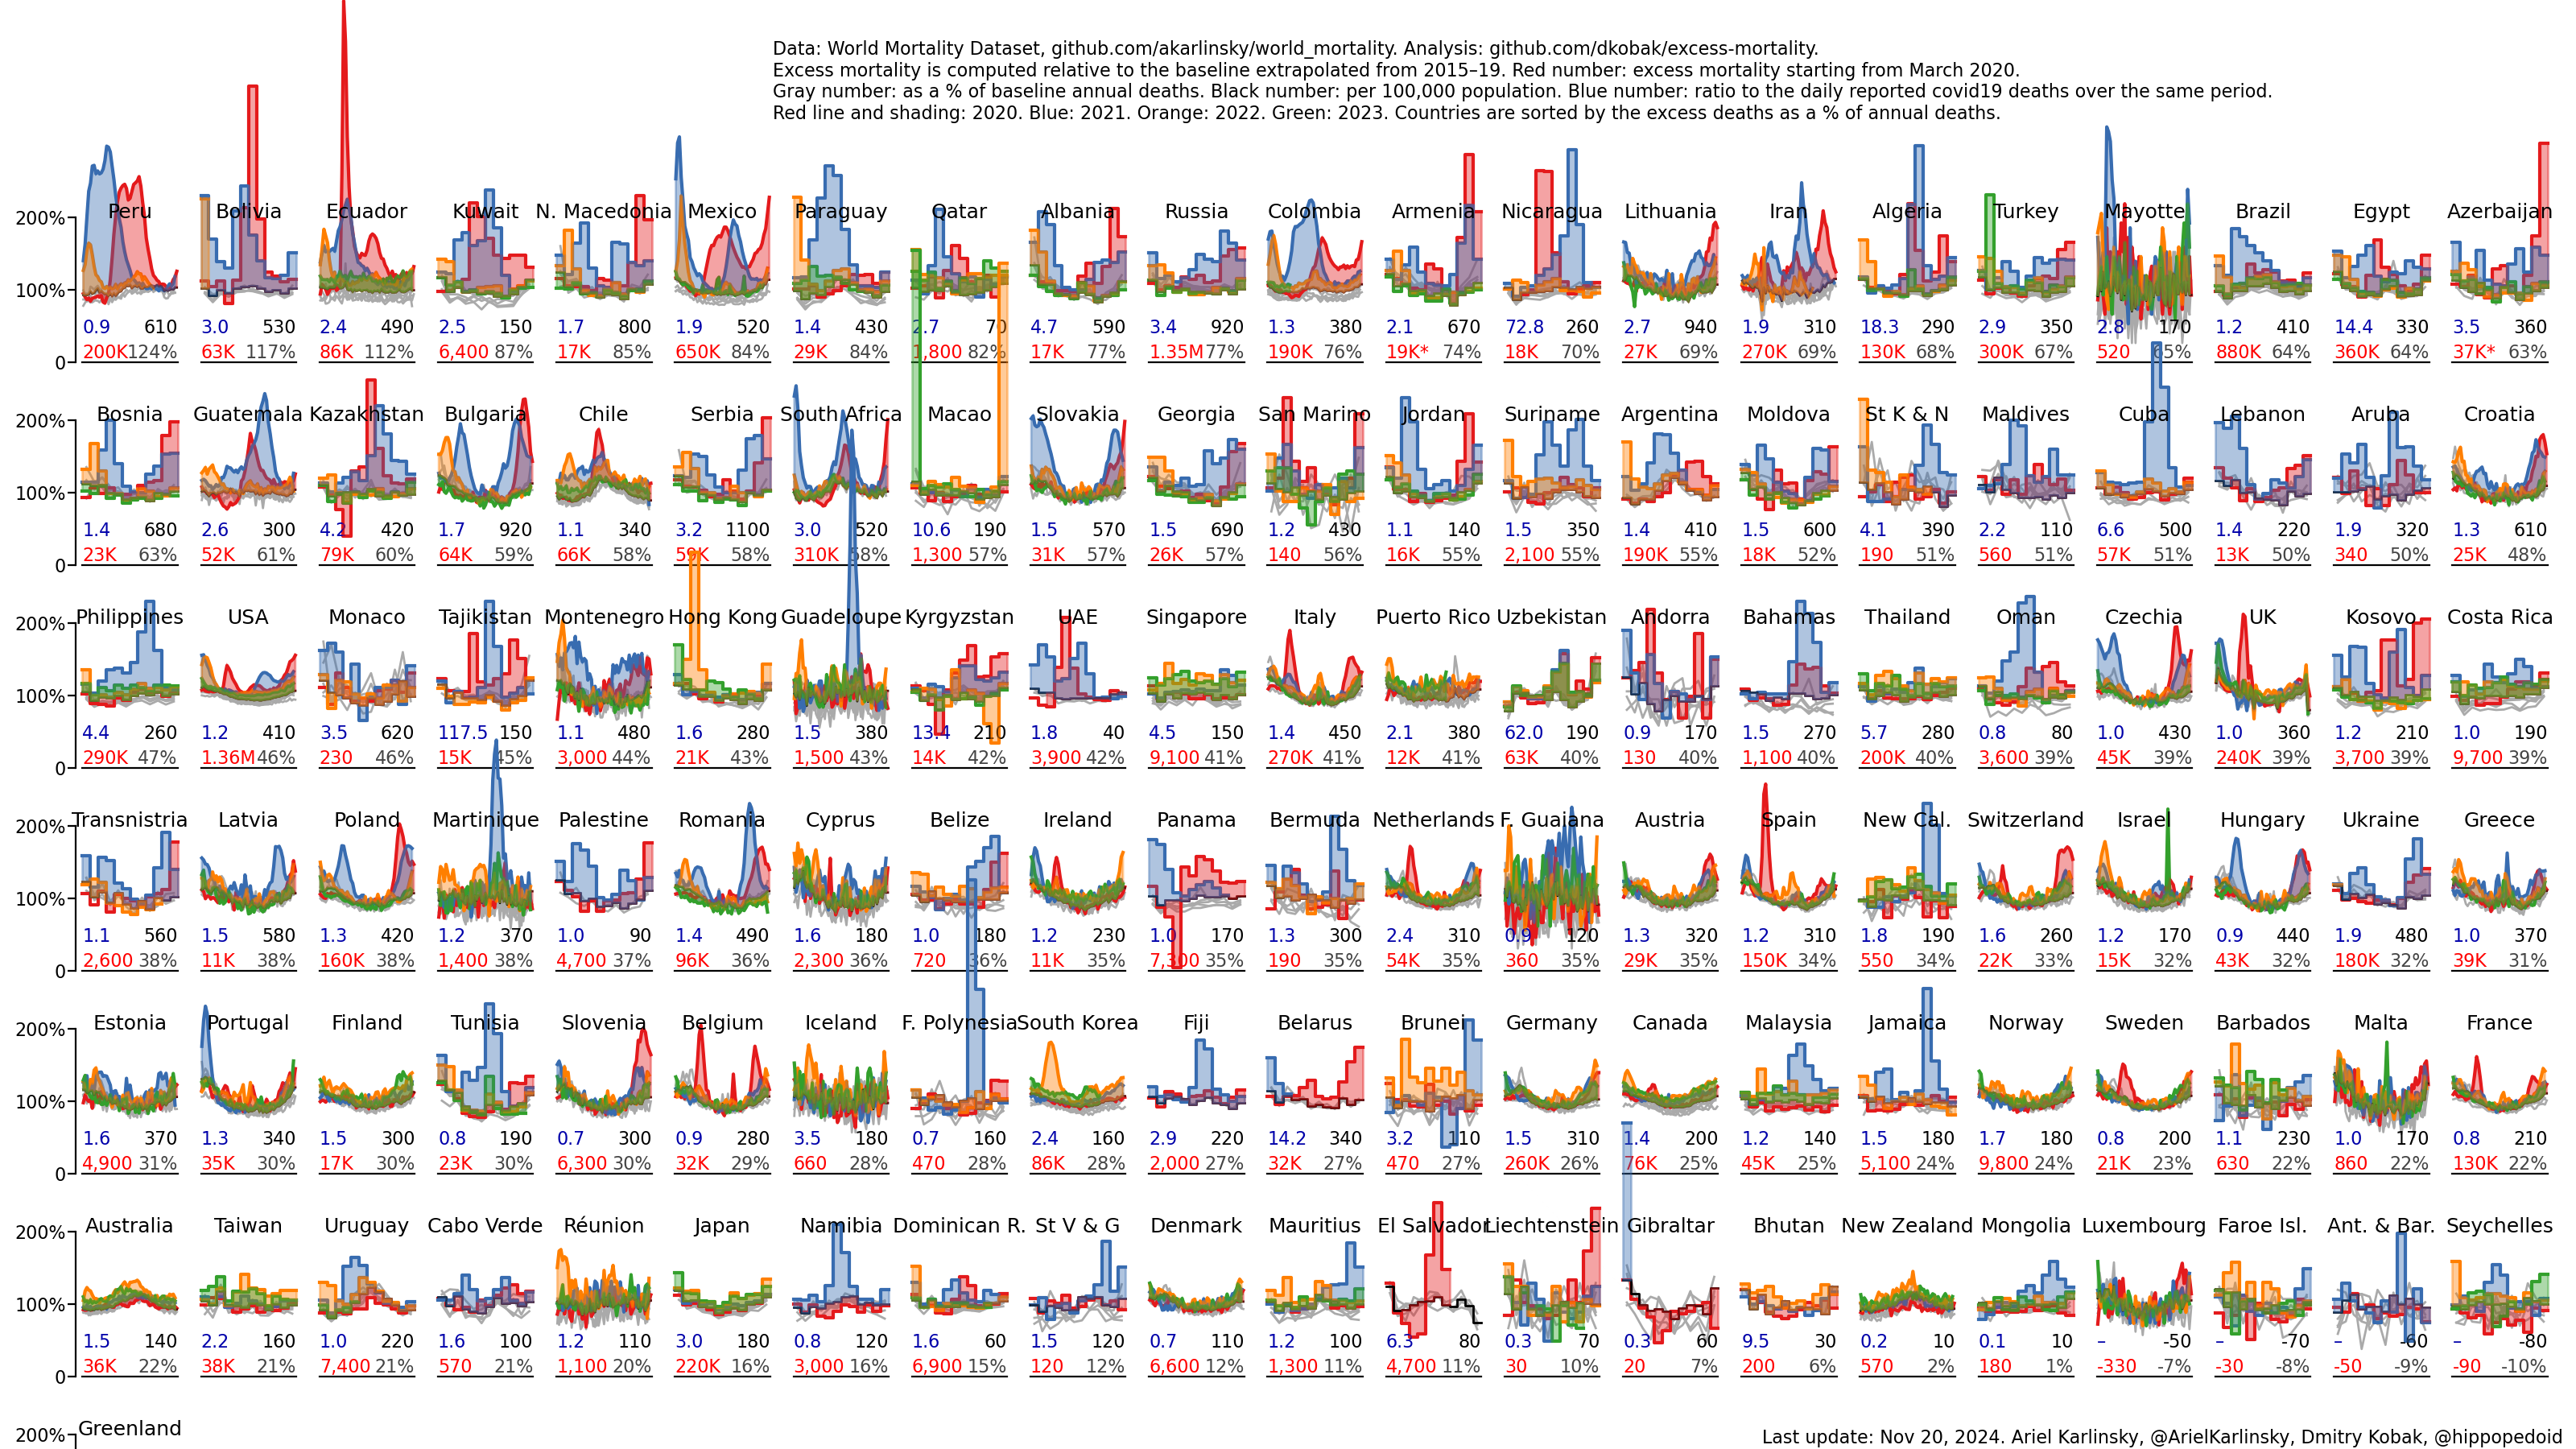
And here is the excess mortality data for all countries
https://raw.githubusercontent.com/dkobak/excess-mortality/ma...
from https://github.com/dkobak/excess-mortality
US Mortality Monitoring – Deaths, Excess, Z-Scores, State Map
21–30 of 66 posts
Re: US Mortality Monitoring – Deaths, Excess, Z-Scores, State Map
#22I dont doubt Covid has caused a bunch of these deaths, particularly in the first wave. But it would be nice to break out suicides and overdoses, as mental health issues are on the rise as a result of lockdowns and the economic fallout.
Here in NZ during our much harsher, but only 6 weeks, lockdown we had a small number of covid deaths, but they were eclipsed by the drop in the road toll - thru 2020 the almost lack of a flu season due to the covid precautions meant a further drop in the annual death rate.
Re: US Mortality Monitoring – Deaths, Excess, Z-Scores, State Map
#23I dont doubt Covid has caused a bunch of these deaths, particularly in the first wave. But it would be nice to break out suicides and overdoses, as mental health issues are on the rise as a result of lockdowns and the economic fallout.
The fact that the 0-24 age range (typically dominated by car accidents and suicides) doesn't see much change suggests that the effect you are suggesting is small or nonexistent.
Your argument doesn't prove that. Using that logic, given that we (collectively) make much fewer car miles due to the lockdowns, we should see a downward change in that age range. Since we don't see a change, that may mean that suicides are on the rise, offsetting the reduction in traffic fatalities.
Re: US Mortality Monitoring – Deaths, Excess, Z-Scores, State Map
#24Does anyone know where to find death statistics for the US for years prior to 2020? Apparently, 3,436,576 persons died in 2020, but what was the totals for 2010 to 2019?
The cdc fluview mortality page. You have to download it as csv, the web plots are flu and pnumonia eatimates.
One interesting observation is that the extra deaths during the pandemic are only a third of the deaths attributed to covid. That implies that two thirds of the covid deaths would have been expected anyway last year without covid?
Re: US Mortality Monitoring – Deaths, Excess, Z-Scores, State Map
#25Does anyone have a list of all countries with annual deaths in 2020, vs prior years for the past decade?
Surely the best way to examine the true impact of COVID is to understand the raw death figures, particularly if there were factors such as weak 2019 flu seasons/deaths which may have contributed to mortality displacement?
Re: US Mortality Monitoring – Deaths, Excess, Z-Scores, State Map
#26I dont doubt Covid has caused a bunch of these deaths, particularly in the first wave. But it would be nice to break out suicides and overdoses, as mental health issues are on the rise as a result of lockdowns and the economic fallout.
In my city, in 2021, 10 Covid deaths and 13 opiate OD deaths.
Re: US Mortality Monitoring – Deaths, Excess, Z-Scores, State Map
#27Does anyone know where to find death statistics for the US for years prior to 2020? Apparently, 3,436,576 persons died in 2020, but what was the totals for 2010 to 2019?
The cdc fluview mortality page. You have to download it as csv, the web plots are flu and pnumonia eatimates. One interesting observation is that the extra deaths during the pandemic are only a third of the deaths attributed to covid. That implies that two thirds of the covid deaths would have been expected anyway last year without covid?
That's accurate of other countries. Excess death outside of 75+ people who had a few more years left is zero.
Re: US Mortality Monitoring – Deaths, Excess, Z-Scores, State Map
#28Does anyone have a list of all countries with annual deaths in 2020, vs prior years for the past decade? Surely the best way to examine the true impact of COVID is to understand the raw death figures, particularly if there were factors such as weak 2019 flu seasons/deaths which may have contributed to mortality displacement?
A journalist in Slovakia did a comparison of current weekly deaths vs extreme values for 2000-2019:
https://dennikn.sk/2304197/prehliadli-sme-mozno-az-styritisi... - the grey dotted dash line is the extreme values for the last 2 decades, red line is the current deaths, black dotted dash line is the threshold of standard deviation.
The most extreme value in the last 2 decades was 1411 deaths per week, last week of 2020 had 2059 deaths per week.
Re: US Mortality Monitoring – Deaths, Excess, Z-Scores, State Map
#29Does anyone have a list of all countries with annual deaths in 2020, vs prior years for the past decade? Surely the best way to examine the true impact of COVID is to understand the raw death figures, particularly if there were factors such as weak 2019 flu seasons/deaths which may have contributed to mortality displacement?
The quality and trustworthiness of that data will vary from very high to we know for a fact its made up.
Re: US Mortality Monitoring – Deaths, Excess, Z-Scores, State Map
#30Does anyone know where to find death statistics for the US for years prior to 2020? Apparently, 3,436,576 persons died in 2020, but what was the totals for 2010 to 2019?
The cdc fluview mortality page. You have to download it as csv, the web plots are flu and pnumonia eatimates. One interesting observation is that the extra deaths during the pandemic are only a third of the deaths attributed to covid. That implies that two thirds of the covid deaths would have been expected anyway last year without covid?
Above 70, the death rate starts to skyrocket naturally. This was also one of the highest risk groups for COVID. A lot of people who were likely to fall down and die or have a stroke/heart attack and never recover instead caught COVID and died a few months earlier. Remember to hug your parents/grandparents as life is short and none of us is promised tomorrow.