Perfetto: Swiss army knife for Linux client tracing
1–10 of 25 posts
Re: Perfetto: Swiss army knife for Linux client tracing
#2Perfetto is definitely one of my favorite tools to use ever, thank you for working on it!
My personal favorite tool I've built this year is to dynamically generate a trace from a sql query, and allow quickly combining queries. Something like `SELECT timestamp, track, name, ` etc. where column names get transformed to packets automatically.
That way I can overlay multiple py-spy traces and instrumentation into a dynamically implemented generated perfetto trace, loaded into a perfetto iframe using the ping/pong mechanism at https://perfetto.dev/docs/visualization/deep-linking-to-perf....
Re: Perfetto: Swiss army knife for Linux client tracing
#3Perfetto is definitely one of my favorite tools to use ever, thank you for working on it! My personal favorite tool I've built this year is to dynamically generate a trace from a sql query, and allow quickly combining queries. Something like `SELECT timestamp, track, name, ` etc. where column names get transformed to packets automatically. That way I can overlay multiple py-spy traces and instrumentation into a dynam…
Thanks for the nice words! Your tool sounds super neat!
We're look at integrating some sort of similarish things into Perfetto itself where, for a synthetically generated trace, you can say "run this SQL query and add a debug track for it on trace load". See the discussion on https://github.com/google/perfetto/issues/1342 :)
Re: Perfetto: Swiss army knife for Linux client tracing
#4Something too complex; I fear I won't ever have enough time to try it and figure out how to apply it for it to be of any use for me.
I wish there was a simpler and quicker introduction into the tool's capabilities than an hour long video and a text article saying it's a swiss army knife that does a lot of things. I need 1 or a few glimpses into it, there's no need to cover every capability thoroughly, show just enough to have some general understanding of how it works and how to use it and how to solve some common problems with it.
Re: Perfetto: Swiss army knife for Linux client tracing
#5Something too complex; I fear I won't ever have enough time to try it and figure out how to apply it for it to be of any use for me. I wish there was a simpler and quicker introduction into the tool's capabilities than an hour long video and a text article saying it's a swiss army knife that does a lot of things. I need 1 or a few glimpses into it, there's no need to cover every capability thoroughly, show just enoug…
This talk was meant to be a comprehensive look into the tool for an audience familiar with performance and tracing (but not necessarily Perfetto and how it can be used on Linux).
If you're more looking for a short intro, I'd maybe suggest our docs website, specifically the page https://perfetto.dev/docs/getting-started/start-using-perfet...
For example:
* if you work in the Linux kernel, try https://perfetto.dev/docs/getting-started/start-using-perfet...
* If you're generally curious about performance or tracing try https://perfetto.dev/docs/getting-started/start-using-perfet...
There's also our quick starts which take you through "I just want to see the tool in action". Find the system tracing one at https://perfetto.dev/docs/getting-started/system-tracing
Re: Perfetto: Swiss army knife for Linux client tracing
#6Something too complex; I fear I won't ever have enough time to try it and figure out how to apply it for it to be of any use for me. I wish there was a simpler and quicker introduction into the tool's capabilities than an hour long video and a text article saying it's a swiss army knife that does a lot of things. I need 1 or a few glimpses into it, there's no need to cover every capability thoroughly, show just enoug…
That's just the nature of these tools though. For example, Windows has its own powerful ETW tracing framework, but using it for real profiling and debugging requires learning a lot about the tools: https://randomascii.wordpress.com/2015/09/24/etw-central/
Re: Perfetto: Swiss army knife for Linux client tracing
#7Glad to see that there's support for CPU sample flamegraphs in Perfetto now that's on par with Google's internal pprof visualizer as alluded to in the talk. Using the internal visualizer to share Windows ETW traces with colleagues was the primary motivation for developing [EtwToPprof](https://github.com/google/EtwToPprof). Now that perfetto supports this natively, I might look into developing EtwToPerfetto :-)
Re: Perfetto: Swiss army knife for Linux client tracing
#8Perfetto is so nice.
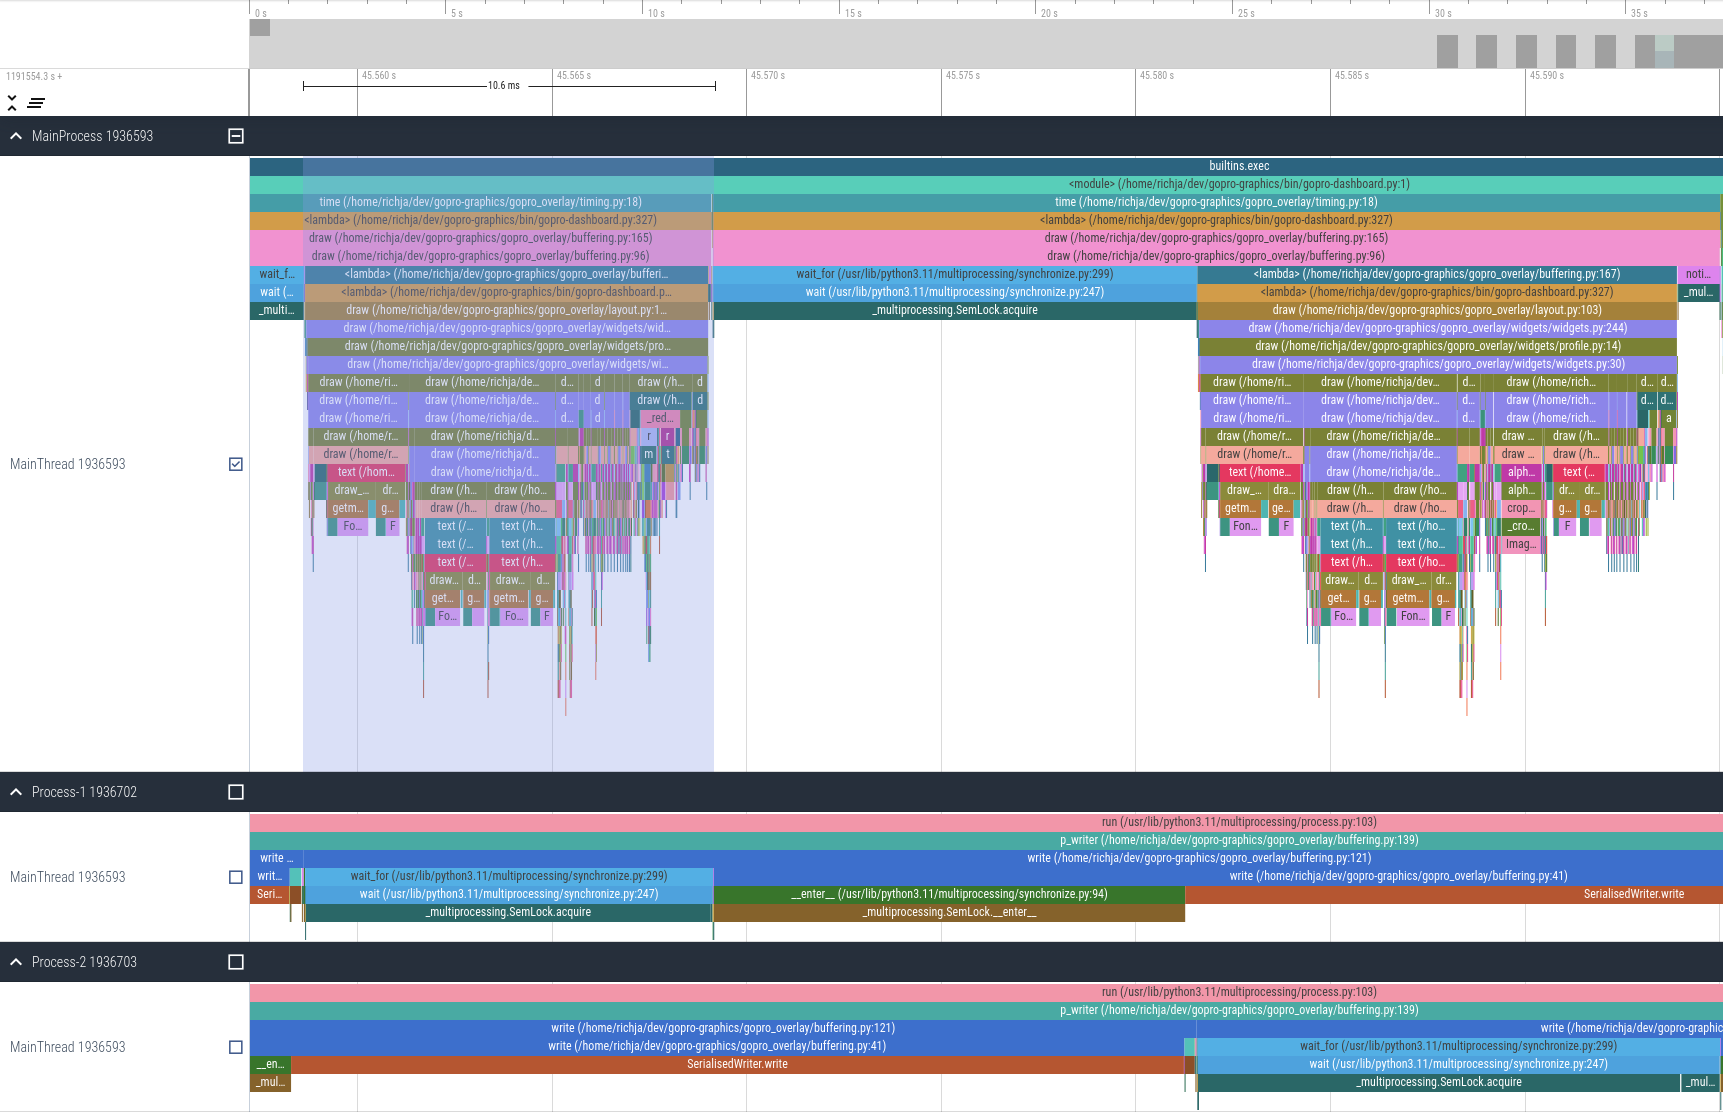
Viztracer is a super library to capture perfetto compatible output from Python.
It helped me find perf issues in literally minutes.
https://raw.githubusercontent.com/time4tea/gopro-dashboard-o...
Re: Perfetto: Swiss army knife for Linux client tracing
#9Glad to see that there's support for CPU sample flamegraphs in Perfetto now that's on par with Google's internal pprof visualizer as alluded to in the talk. Using the internal visualizer to share Windows ETW traces with colleagues was the primary motivation for developing [EtwToPprof]( https://github.com/google/EtwToPprof ). Now that perfetto supports this natively, I might look into developing EtwToPerfetto :-)
Fun fact: Perfetto also gained support for the pprof format within the last month :)
It opens a special "aggregate flame graph" view of the profile since pprof does not preserve time information. But it works! We use it for visualizing aggregates across thousands of profiles in production!
Re: Perfetto: Swiss army knife for Linux client tracing
#10Something too complex; I fear I won't ever have enough time to try it and figure out how to apply it for it to be of any use for me. I wish there was a simpler and quicker introduction into the tool's capabilities than an hour long video and a text article saying it's a swiss army knife that does a lot of things. I need 1 or a few glimpses into it, there's no need to cover every capability thoroughly, show just enoug…
Go to https://ui.perfetto.dev/. On the left sidebar, under "Example traces", click "Open Android example".
For a simple example using your own data, save this as a file and open it via "Open trace file":
  [
    {"name": "Example 1", "ph": "X", "ts": 1, "dur": 1, "pid": 0, "tid": 0},
    {"name": "Example 2", "ph": "X", "ts": 3, "dur": 2, "pid": 0, "tid": 0},
    {"name": "Example 3", "ph": "X", "ts": 2, "dur": 1, "pid": 0, "tid": 1},
    {"name": "Example 4", "ph": "X", "ts": 4, "dur": 2, "pid": 0, "tid": 1}
  ]