Share of Income Gains by Quintile - Great Depression til Now
1–10 of 302 posts
Re: Share of Income Gains by Quintile - Great Depression til Now
#2Is anyone able to explain this chart for me?
When they say that the 'Top Fifth' are all of the people in the labor force making over USD112541, does that mean that 20% of American workers make more than that?
That's pretty astounding to me, if it is indeed the case. At a labor force size of about 154 million people, that means that over 30 million people are making over USD112541. I know that a good number of people are making WELL over USD112541 actually, though I thought it was just because of my neighborhood and social group.
To see the aggregate numbers is staggering. Where is the money coming from to pay that many people that much? I have some inkling that this is what leverage and debt do for an economy, but ... wow.
Any econ profs, or grad students around to explain ho this is possible?
Re: Share of Income Gains by Quintile - Great Depression til Now
#3So the working class has been taken to the slaughterhouse?
My billion dollar question: What happened at the end of the 70's / beginning of the 80's?
Re: Share of Income Gains by Quintile - Great Depression til Now
#4The primary problem with this type of comparison is that it completely ignores economic mobility. Someone simply isn't born into a given income bracket and stays there for life. Most people's earning potential goes up over time. Speaking for myself, I think I've been in all five quintiles.
Re: Share of Income Gains by Quintile - Great Depression til Now
#5What happened in the late 70s?
Re: Share of Income Gains by Quintile - Great Depression til Now
#6I don't know if I saw this on HackerNews or Reddit, but this one has a graph that goes well with the link in the parent post.
Left behind in America: Who's to blame for the wealth divide?
Re: Share of Income Gains by Quintile - Great Depression til Now
#7Is anyone able to explain this chart for me? When they say that the 'Top Fifth' are all of the people in the labor force making over USD112541, does that mean that 20% of American workers make more than that? That's pretty astounding to me, if it is indeed the case. At a labor force size of about 154 million people, that means that over 30 million people are making over USD112541. I know that a good number of people…
These are household income quantiles, not personal income quantiles. It's not stated on the chart, but that lines up better with: http://en.wikipedia.org/wiki/Household_income_in_the_United_...
Re: Share of Income Gains by Quintile - Great Depression til Now
#8What happened in the late 70s?
Reagan (1981-1989).
Re: Share of Income Gains by Quintile - Great Depression til Now
#9The primary problem with this type of comparison is that it completely ignores economic mobility. Someone simply isn't born into a given income bracket and stays there for life. Most people's earning potential goes up over time. Speaking for myself, I think I've been in all five quintiles.
The US doesn't do terribly well in terms of economic mobility compared to other developed nations, either: http://www.npr.org/templates/story/story.php?storyId=4662456
It's hard to move out of the bottom quintile when the bottom quintile is generally doing so poorly, though of course it's possible, in some cases, to still do so.
Re: Share of Income Gains by Quintile - Great Depression til Now
#10The primary problem with this type of comparison is that it completely ignores economic mobility. Someone simply isn't born into a given income bracket and stays there for life. Most people's earning potential goes up over time. Speaking for myself, I think I've been in all five quintiles.
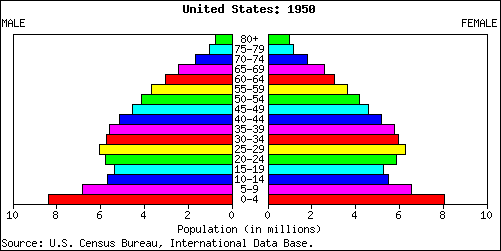
Yup. The chart ignores changes in demographics.
Compare the US population pyramid in 1950: http://tfw.cachefly.net/snm/images/nm/pyramids/us-1950.png
To the US population pyramid in 2005: http://tfw.cachefly.net/snm/images/nm/pyramids/us-2005.png
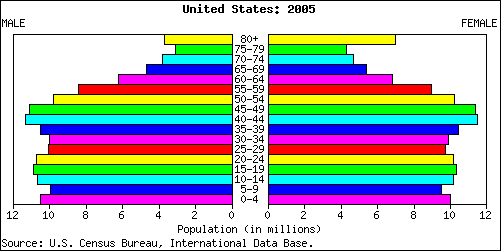
Look at just how many more people are in the 40-55 demographic (peak earning years).