Live data from Hacker News

Show HN: Create diagrams of complex data flows in software systems

github.com

11–20 of 67 posts

Re: Show HN: Create diagrams of complex data flows in software systems

#11
Wow, this looks very interesting. I saw the diagram of your own application and it looks more dynamic than the ones that I am generally used to at work.

I am curious about the motivation behind this project. What experiences triggered you to think that static diagrams are a problem?

Your answer will help me decide whether I'd like to use it for my own documentation or not.

Re: Show HN: Create diagrams of complex data flows in software systems

#12
I love it, but I can't help but wonder why I almost never see complete or up to date diagrams in an enterprise or at scale software engineering setting, despite there being so many tools in this space (mermaid, uml, draw.io, graphviz, etc). I wonder what the barrier is or how to make tools like this fundamentally different so that we would see more adoption.

This comes up frequently in the context of secure design review, or more generally when outside stakeholders need to understand a foreign system.

Nobody argues against diagrams as good practice, but so few actually make them. That tells me incentives/costs are still off, despite good intent.

Information extraction from design docs could be one approach to suggest a diagram for free but that creates a dependency on the fidelity of the design document.

Re: Show HN: Create diagrams of complex data flows in software systems

#14

I love it, but I can't help but wonder why I almost never see complete or up to date diagrams in an enterprise or at scale software engineering setting, despite there being so many tools in this space (mermaid, uml, draw.io, graphviz, etc). I wonder what the barrier is or how to make tools like this fundamentally different so that we would see more adoption. This comes up frequently in the context of secure design re…

My take is that it's a bit worse than that: the whole doc tooling scene is a dumpster fire. I want to maintain technical documentation under revision control (same revision control system as I use for source code), and I want to be able to embed diagrams in said documents (also under revision control) and I want to wysiwyg edit those things. Amazingly in 2024 this does not exist.

Re: Show HN: Create diagrams of complex data flows in software systems

#15
post #5
post #4

I know you said you prefer the GUI over text-based, but that was the exact thing I wanted to ask for after trying your demo. GUI just doesn’t scale like text does. How will you be able to generate a diagram from code or a running process unless you have some intermediate textual representation? I assume you do anyways, at least implicitly, to save the state of your GUI’s output. You should bring that into focus. The…

> I assume you do anyways, at least implicitly, to save the state of your GUI’s output. You should bring that into focus. Indeed, I do have a YAML / JSON representation under the hood, which is validated by JSON Schema. In the app, you can click on "file > yaml editor" to access it. I thought about having a mermaid-like syntax on top of my YAML representation but before adding this, I need to have a proper "auto-layo…

Thanks for the responses! Honestly I wouldn’t hate just using YAML to edit these. Great points otherwise. I didn’t see in the demo, but if I could scrub back/forth through the animation, that would be really nice. Good luck on the project!

Re: Show HN: Create diagrams of complex data flows in software systems

#17

I love it, but I can't help but wonder why I almost never see complete or up to date diagrams in an enterprise or at scale software engineering setting, despite there being so many tools in this space (mermaid, uml, draw.io, graphviz, etc). I wonder what the barrier is or how to make tools like this fundamentally different so that we would see more adoption. This comes up frequently in the context of secure design re…

> why I almost never see complete

That's a huge scope question on its own. What's "complete"? How low level or wide do you go? What about the view of internals of the external systems you rely on? What about their mapping to teams/owners? C4 helps a bit here by saying "whole organisation throws everything possible into this and when you want to see it, you use scoped views instead".

> or up to date diagrams

"When exactly does the system change" is tricky too. When you change the code? When you enable the new system? Who knows that the diagram of the system exists and where? It's a bit of an issue of unknown unknowns. Again, the C4 idea helps here a bit, but there are still going to be random projections of state at a given time saved in various places.

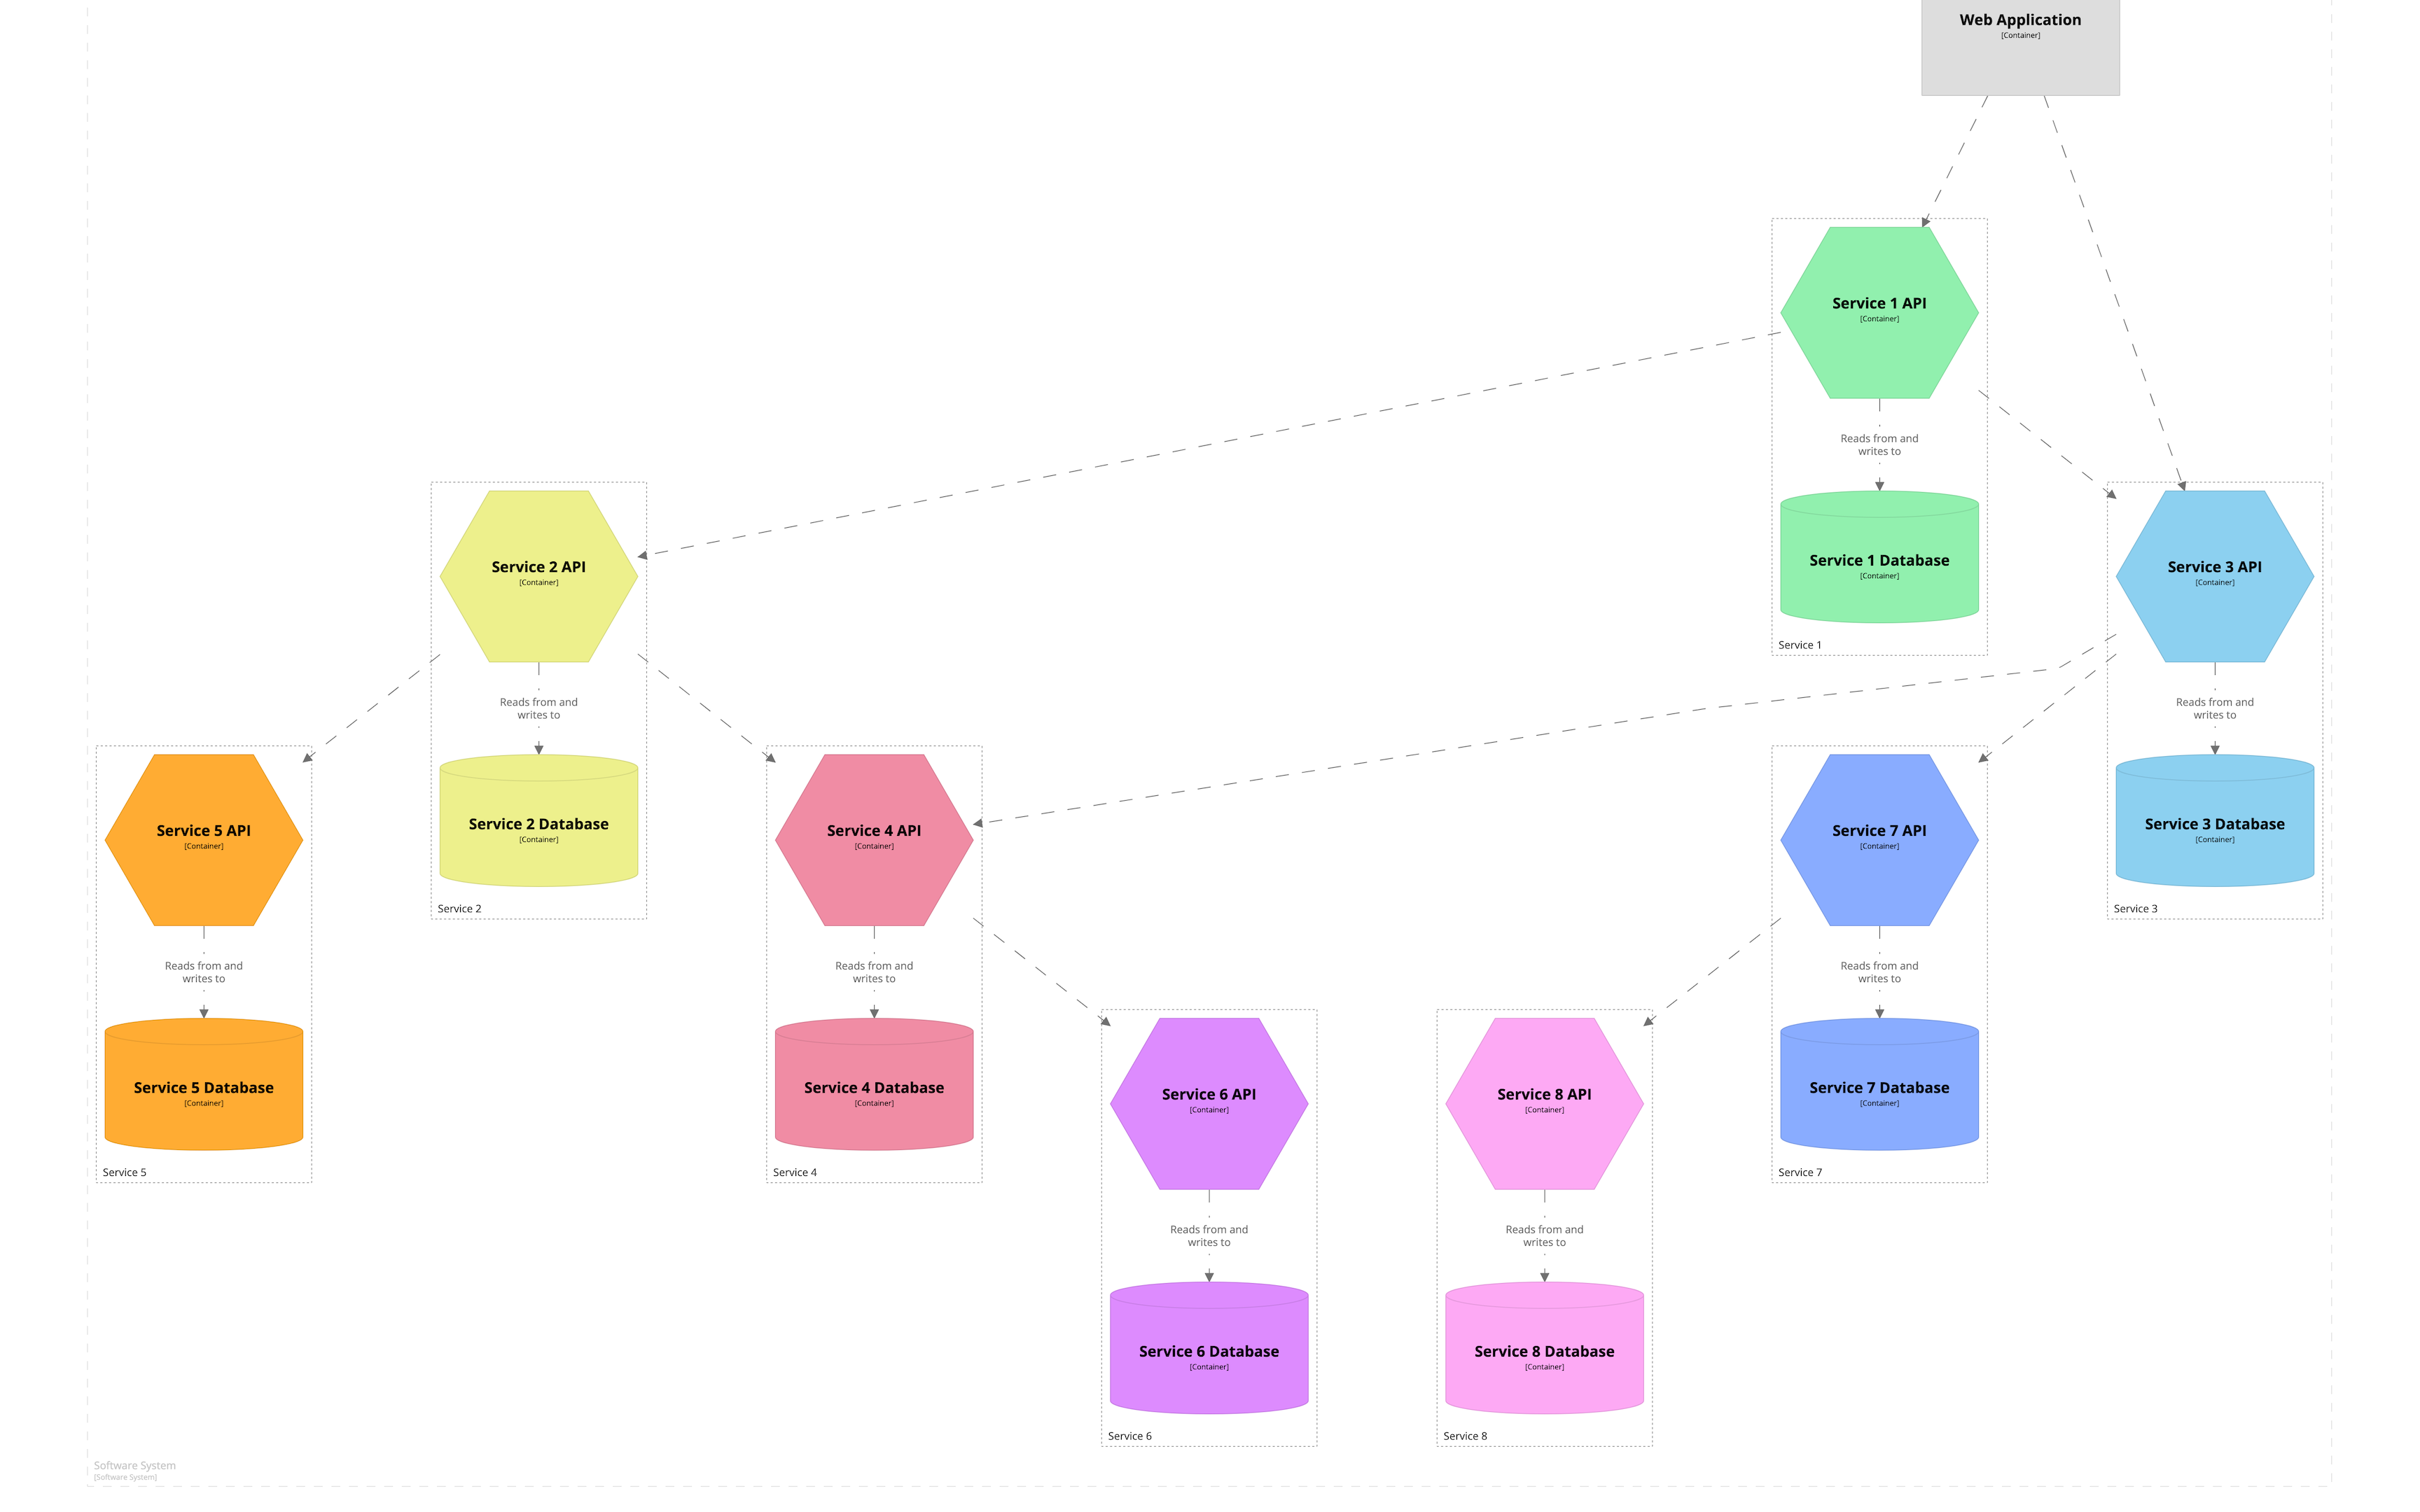
Another big issue is that structure and presentation are very different. Generated diagrams of infrastructure or code look shit, universally. On the other hand, well presented diagrams are just snapshots in time that get preserved for years even if their outdated. I mean this is what C4 page shows as one of their results https://c4model.com/img/alternative-1.png which is an unreadable mess and this is what they initially complain about https://c4model.com/img/sketch-2.jpg which is perfectly sized and context specific goodness. The first is good for knowledge preservation, but if anyone needs to understand things, I'm making the second one for them.

Re: Show HN: Create diagrams of complex data flows in software systems

#18

I love it, but I can't help but wonder why I almost never see complete or up to date diagrams in an enterprise or at scale software engineering setting, despite there being so many tools in this space (mermaid, uml, draw.io, graphviz, etc). I wonder what the barrier is or how to make tools like this fundamentally different so that we would see more adoption. This comes up frequently in the context of secure design re…

My take is that it's a bit worse than that: the whole doc tooling scene is a dumpster fire. I want to maintain technical documentation under revision control (same revision control system as I use for source code), and I want to be able to embed diagrams in said documents (also under revision control) and I want to wysiwyg edit those things. Amazingly in 2024 this does not exist.

Have you taken a look at swimm.io? Been curious about it for a while now but not a fan of the friction to demo it.

Re: Show HN: Create diagrams of complex data flows in software systems

#19

I love it, but I can't help but wonder why I almost never see complete or up to date diagrams in an enterprise or at scale software engineering setting, despite there being so many tools in this space (mermaid, uml, draw.io, graphviz, etc). I wonder what the barrier is or how to make tools like this fundamentally different so that we would see more adoption. This comes up frequently in the context of secure design re…

If you want to understand the underlying problem, think about geographical mapping (e.g. Google Maps). When drawing a map, how do you decide what gets featured? Roads, businesses? How big can the text be? How do you keep it all readable?

Diagramming is the same problem, but usually lacking the context to decide what to draw. The same stakeholders may be interested in different combinations of features depending on which business questions they're trying to answer. Geographic mapping is practically a constrained domain by comparison. And it's supposed to be feasible to do it automatically for systems diagrams? /hard-skeptic

Re: Show HN: Create diagrams of complex data flows in software systems

#20

I love it, but I can't help but wonder why I almost never see complete or up to date diagrams in an enterprise or at scale software engineering setting, despite there being so many tools in this space (mermaid, uml, draw.io, graphviz, etc). I wonder what the barrier is or how to make tools like this fundamentally different so that we would see more adoption. This comes up frequently in the context of secure design re…

My take is that it's a bit worse than that: the whole doc tooling scene is a dumpster fire. I want to maintain technical documentation under revision control (same revision control system as I use for source code), and I want to be able to embed diagrams in said documents (also under revision control) and I want to wysiwyg edit those things. Amazingly in 2024 this does not exist.

Jetbrains' recent WriterSide tool is a great addition into this space. It's not exactly wysiwyg, it's side-by-side live preview with different source languages (right now, markdown and some xml language are supported, but they want to support more popular doc languages).

It allows you to specify definitions in one location, and reference them in other pages. So if you have for example a documentation page which is about "installing our nodejs package", you can write a version in vars.json or vars.xml or whatever, and reference it in your installation documentation page.

When you later have another page which is saying "Hey, we found a bit of an issue with ...this-or-that... package because we're using $NODE_VERSION, and the package hasn't been updated so we have ...such-and-so... workaround", you know when you update the $NODE_VERSION in your vars, that you need to take a look at that package again.

It's an extremely basic part of software development, being able to define variables, but I think this is a very good sign of powerful documentation tooling.

The only major downside about the platform is that their XML (HTML) extensions to markdown are proprietary, and as such the platform isn't able to grow outside of Jetbrains' oversight. I'm still debating whether I want to switch from Gitlab's Wiki (which is very basic but is really really easy to edit for anyone on the team) to a solution like Jetbrains' Writerside.
Post reply on HN